Answered step by step
Verified Expert Solution
Question
1 Approved Answer
Replicate the plots in Figure 12.29 and Figure 12.30. Using Python Code. Figure 12.29 With At -0.003125 In - 960) on the interval Ost 3,
Replicate the plots in Figure 12.29 and Figure 12.30. Using Python Code.
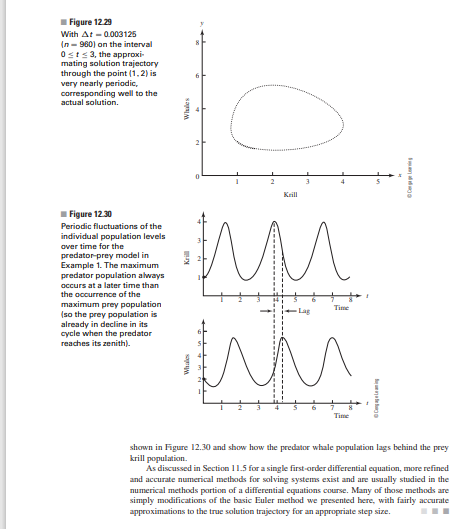
Figure 12.29 With At -0.003125 In - 960) on the interval Ost 3, the approxi mating solution trajectory through the point (1.2) is very nearly periodic, corresponding well to the actual solution. Wules 2 3 4 Krill Figure 12.30 Periodic fluctuations of the individual population levels over time for the predator prey model in Example 1. The maximum predator population always occurs at a later time than the occurrence of the maximum prey population (so the prey population is already in decline in its cycle when the predator reaches its zenith). MM W Time -Lag Time shown in Figure 12.30 and show how the predator whale population lags behind the prey krill population As discussed in Section 11.5 for a single first-order differential equation, more refined and accurate numerical methods for solving systems exist and are usually studied in the numerical methods portion of a differential equations course. Many of those methods are simply modifications of the basic Euler method we presented here, with fairly accurate approximations to the true solution trajectory for an appropriate step sizeStep by Step Solution
There are 3 Steps involved in it
Step: 1
Get Instant Access to Expert-Tailored Solutions
See step-by-step solutions with expert insights and AI powered tools for academic success
Step: 2
Step: 3
Ace Your Homework with AI
Get the answers you need in no time with our AI-driven, step-by-step assistance
Get Started