Answered step by step
Verified Expert Solution
Question
1 Approved Answer
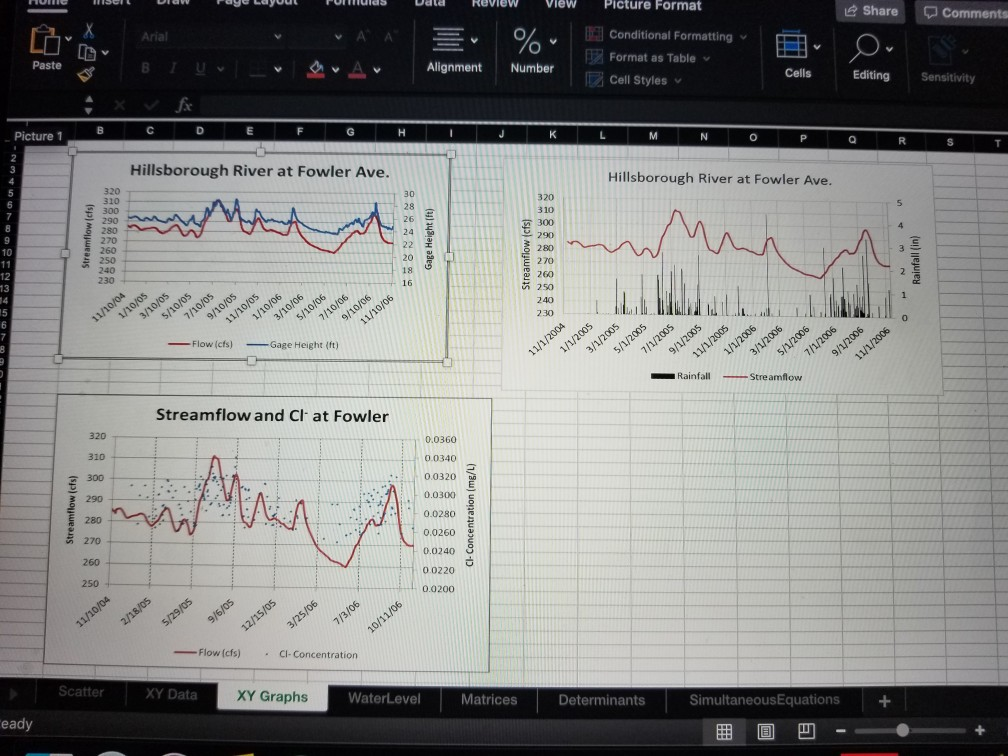
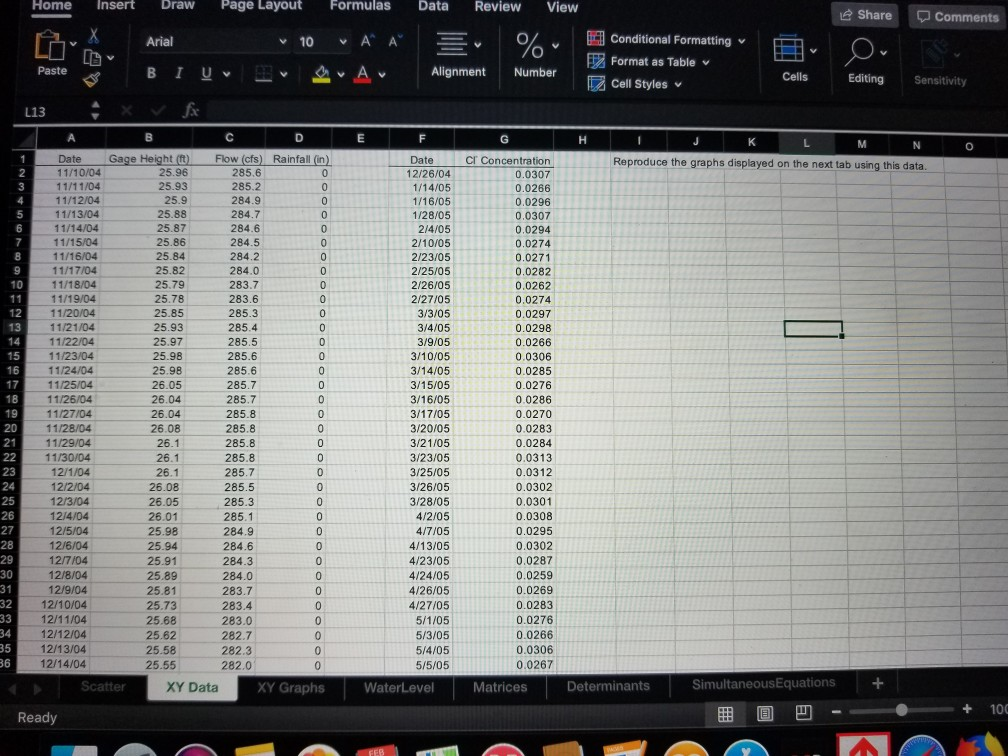
Reproduce the graphs shown with the data provided(explain in detail how to make those graphs in excel from the data provided) Share -comments Era Conditional
Reproduce the graphs shown with the data provided(explain in detail how to make those graphs in excel from the data provided)


Share -comments Era Conditional Formatting 1%. Alignment Number Format as Table v Paste Clls Editing Sensitivity Le Cell Styles Picture 1 B Hillsborough River at Fowler Ave. Hillsborough River at Fowler Ave. 30 28 26 24 320 310 310 290 280 270 290 280 270 20 18 16 2 260 250 240 230 230 13 0 -Flow (cfs) --Gage Height(ft) -Rainfall __ Streamflow Streamflow and Cl at Fowler 0.0360 0.0340 0.0320 310 300 290 280 270 A 0.0300 0.0280 0.0260 0.0240 0.0220 0.0200 250 Flow(cfs) CI-Concentration . Scatter XY Data XY Graphs WaterLevel Matrices Determinants SimultaneousEquations + eady Home Insert Draw Page Layout Formulas Data Review View L* 10." " . . Ev %-| Conditional Formatting v E- p. Format as Table v 1 lv vA, v Alignment Number Gage Height ) Flow (cfs) Rainfall (in) CI Concentration 0.0307 0.0266 0.0296 0.0307 0.0294 Reproduce the graphs displayed on the next tab using this data. 11/10/04 11/11/04 11/12/04 11/13/04 11/14/04 11/15/04 11/16/04 11/17/04 11/18/04 11/19/04 11/20/04 11/21/04 12/26/04 1/16/05 1/28/05 2/4/05 2/10/05 2/23/05 2/25/05 2/26/05 2/27/05 3/3/05 3/4/05 3/9/05 3/10/05 3/14/05 3/15/05 3/16/05 3/17/05 3/20/05 3/21105 3/23/05 3/25/05 3/26/05 3/28/05 4/2/05 4/7/05 4/13/05 4/23/05 4/24/05 4/26/05 4/27/05 284.7 0.0282 0.0262 0,0274 0.0297 25.78 283.6 285.3 0 11/23/04 11/24/04 0.0285 0.0276 0.0286 0.0270 0.0283 0.0284 285.6 285.7 285.8 11/27/04 11/29/04 26.1 26.1 0.0312 0.0302 0.0301 0.0308 0.0295 0.0302 0.0287 0.0259 0.0269 0.0283 0.0276 0.0266 0.0306 0.0267 12/1/04 285.7 285.1 284.6 12/7/04 12/8/04 12/10/04 12/11/04 12/12/04 12/13/04 12/14/04 283.0 282.7 282.3 5/3/05 5/4/05 5/5/05 XY Data XY Graphs WaterLevel Matrices Determinants SimultaneousEquations Share -comments Era Conditional Formatting 1%. Alignment Number Format as Table v Paste Clls Editing Sensitivity Le Cell Styles Picture 1 B Hillsborough River at Fowler Ave. Hillsborough River at Fowler Ave. 30 28 26 24 320 310 310 290 280 270 290 280 270 20 18 16 2 260 250 240 230 230 13 0 -Flow (cfs) --Gage Height(ft) -Rainfall __ Streamflow Streamflow and Cl at Fowler 0.0360 0.0340 0.0320 310 300 290 280 270 A 0.0300 0.0280 0.0260 0.0240 0.0220 0.0200 250 Flow(cfs) CI-Concentration . Scatter XY Data XY Graphs WaterLevel Matrices Determinants SimultaneousEquations + eady Home Insert Draw Page Layout Formulas Data Review View L* 10." " . . Ev %-| Conditional Formatting v E- p. Format as Table v 1 lv vA, v Alignment Number Gage Height ) Flow (cfs) Rainfall (in) CI Concentration 0.0307 0.0266 0.0296 0.0307 0.0294 Reproduce the graphs displayed on the next tab using this data. 11/10/04 11/11/04 11/12/04 11/13/04 11/14/04 11/15/04 11/16/04 11/17/04 11/18/04 11/19/04 11/20/04 11/21/04 12/26/04 1/16/05 1/28/05 2/4/05 2/10/05 2/23/05 2/25/05 2/26/05 2/27/05 3/3/05 3/4/05 3/9/05 3/10/05 3/14/05 3/15/05 3/16/05 3/17/05 3/20/05 3/21105 3/23/05 3/25/05 3/26/05 3/28/05 4/2/05 4/7/05 4/13/05 4/23/05 4/24/05 4/26/05 4/27/05 284.7 0.0282 0.0262 0,0274 0.0297 25.78 283.6 285.3 0 11/23/04 11/24/04 0.0285 0.0276 0.0286 0.0270 0.0283 0.0284 285.6 285.7 285.8 11/27/04 11/29/04 26.1 26.1 0.0312 0.0302 0.0301 0.0308 0.0295 0.0302 0.0287 0.0259 0.0269 0.0283 0.0276 0.0266 0.0306 0.0267 12/1/04 285.7 285.1 284.6 12/7/04 12/8/04 12/10/04 12/11/04 12/12/04 12/13/04 12/14/04 283.0 282.7 282.3 5/3/05 5/4/05 5/5/05 XY Data XY Graphs WaterLevel Matrices Determinants SimultaneousEquations
Step by Step Solution
There are 3 Steps involved in it
Step: 1

Get Instant Access to Expert-Tailored Solutions
See step-by-step solutions with expert insights and AI powered tools for academic success
Step: 2

Step: 3

Ace Your Homework with AI
Get the answers you need in no time with our AI-driven, step-by-step assistance
Get Started


