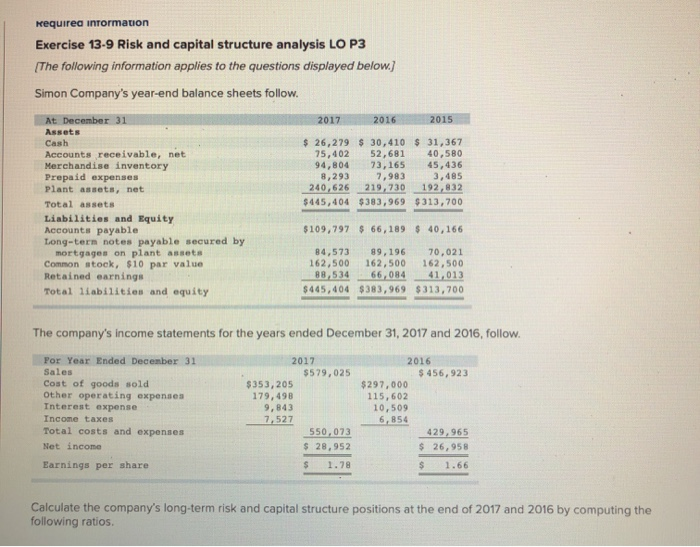
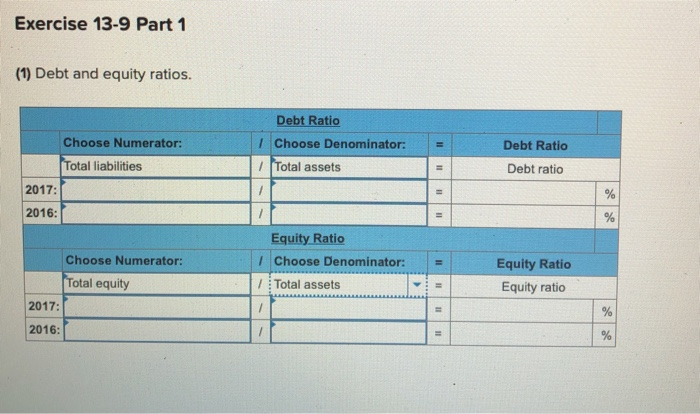
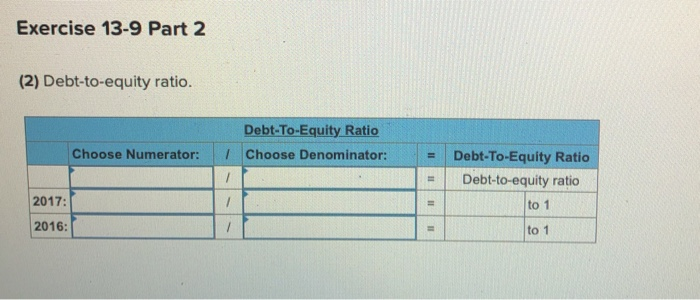
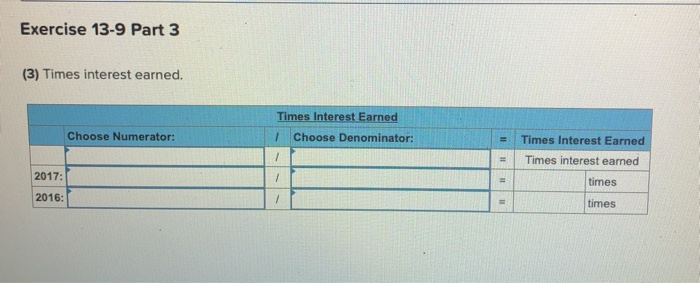
requirea information Exercise 13-9 Risk and capital structure analysis LO P3 The following information applies to the questions displayed below.) Simon Company's year-end balance sheets follow. 2017 2016 2015 At December 31 Assets Cash Accounts receivable, net Merchandise inventory Prepaid expenses Plant assets, net Total assets Liabilities and Equity Accounts payable Long-term notes payable secured by mortgages on plant assets Common stock, $10 par value Retained earnings Total liabilities and equity $ 26,279 $ 30,410 $ 31,367 75,402 52,681 40,580 94,804 73,165 45,436 8.293 2.9833 ,485 240,626 219,730 192,832 $445,404 $383,969 $313,700 $109,797 $ 66,189 $ 40,166 84,573 99,196 70,021 162,500 162,500 162,500 88,534 66,084 41,013 $445,404 $383,969 $313,700 The company's income statements for the years ended December 31, 2017 and 2016, follow. Por Year Ended December 31 Sales Cost of goods sold Other operating expenses Interest expense Income taxes Total costs and expenses Net income 2017 $579,025 $353,205 179,498 9.843 7,527 550.073 2016 $ 456, 923 $297,000 115, 602 10,509 6,854 429,965 $ 26, 958 Earnings per share Calculate the company's long-term risk and capital structure positions at the end of 2017 and 2016 by computing the following ratios. Exercise 13-9 Part 1 (1) Debt and equity ratios. Debt Ratio 1 Choose Denominator: Total assets = Debt Ratio Debt ratio Choose Numerator: Total liabilities 2017: 2016: Equity Ratio 1 Choose Denominator: Total assets = Equity Ratio Equity ratio Choose Numerator: Total equity 2017: 2016: 11 Exercise 13-9 Part 2 (2) Debt-to-equity ratio. Debt-To-Equity Ratio 7 Choose Denominator: Choose Numerator: - Debt-To-Equity Ratio Debt-to-equity ratio to 1 2017: 2016: to 1 Exercise 13-9 Part 3 (3) Times interest earned. Times Interest Earned 1 Choose Denominator: Choose Numerator: Times Interest Earned Times interest earned times 2017: 2016: times