

Answered step by step
Verified Expert Solution
Question
1 Approved Answer
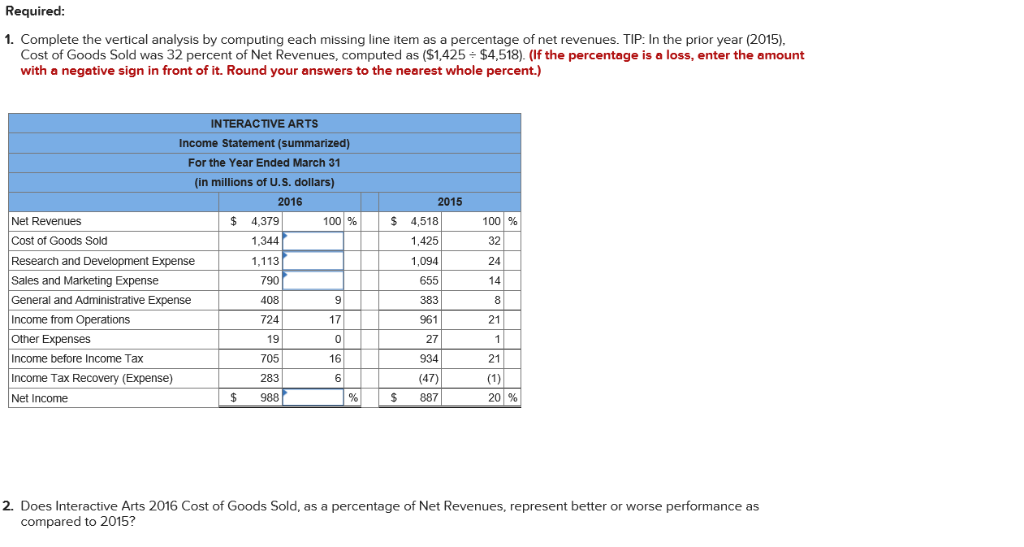
Required 1. Complete the vertical analysis by computing each missing line item as a percentage of net revenues. TIP: In the prior year (2015), Cost
Step by Step Solution
There are 3 Steps involved in it
Step: 1

Get Instant Access to Expert-Tailored Solutions
See step-by-step solutions with expert insights and AI powered tools for academic success
Step: 2

Step: 3
Ace Your Homework with AI
Get the answers you need in no time with our AI-driven, step-by-step assistance
Get Started
Marketing Audit Reports Get An Extensive List Of 130 Marketing Audit Reports
Authors: Jack Chalow
1st Edition
B0BQXYKYZJ, 979-8371063076