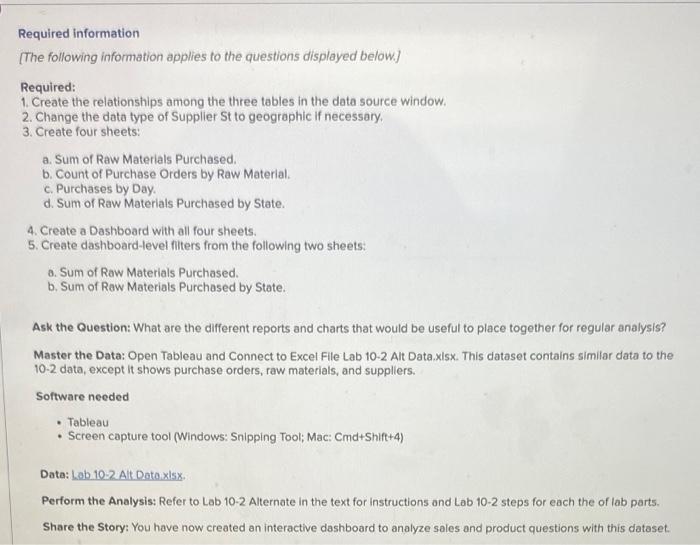
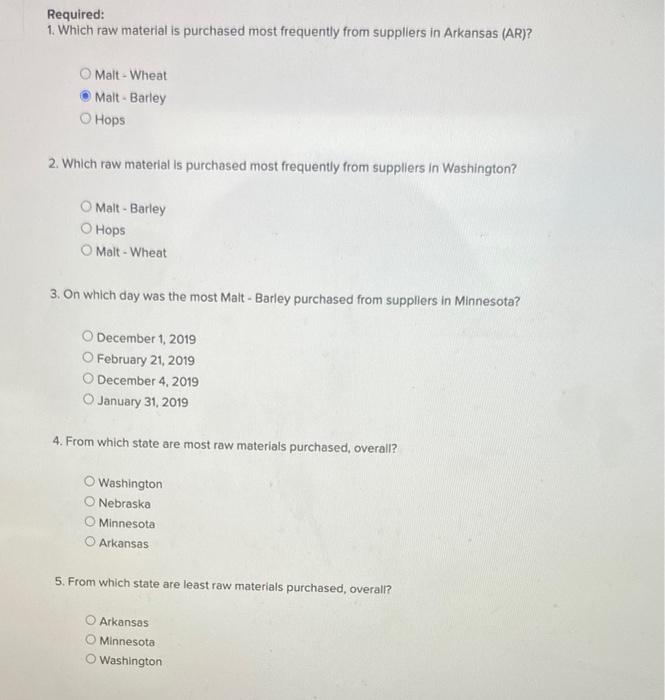
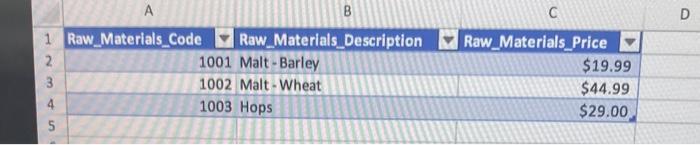
Required: 1. Create the relationships among the three tables in the data source window. 2. Change the data type of Supplier St to geographic if necessary. 3. Create four sheets: a. Sum of Raw Materials Purchased. b. Count of Purchase Orders by Raw Material. c. Purchases by Day. d. Sum of Raw Materials Purchased by State. 4. Create a Dashboard with all four sheets. 5. Create dashboard-level fliters from the following two sheets: 0. Sum of Raw Materials Purchased. b. Sum of Raw Materials Purchased by State. Ask the Question: What are the different reports and charts that would be useful to place together for regular analysis? Master the Data: Open Tableau and Connect to Excel File Lab 10-2 Alt Data.xlsx. This dataset contains similar data to the 10-2 data, except it shows purchase orders, raw materials, and suppliers. Software needed - Tableau - Screen capture tool (Windows: Snlpping Tool; Mac: Cmd+Shift+4) Data: Lab 10-2 Alt Dato x15x. Perform the Analysis: Refer to Lab 10-2 Alternate in the text for instructions and Lab 10-2 steps for each the of lab parts. Share the Story: You have now created an interactive dashboard to analyze sales and product questions with this dataset. Required: 1. Which raw material is purchased most frequently from suppliers in Arkansas (AR)? Mait-WheatMalt-Barley Hops 2. Which raw material is purchased most frequently from suppliers in Washington? Malt - Barley Hops Malt - Wheat 3. On which day was the most Malt - Barley purchased from suppllers in Minnesota? December 1, 2019 February 21, 2019 December 4, 2019 January 31, 2019 4. From which state are most raw materials purchased, overall? Washington Nebraska Minnesota Arkansas 5. From which state are least raw materials purchased, overall? Arkansas Minnesota Washington Ractiace orter 10 A B c D 1 Raw_Materials_Code Raw_Materials_Description Raw_Materials_Price $19.99 $44.99 $29.00 Required: 1. Create the relationships among the three tables in the data source window. 2. Change the data type of Supplier St to geographic if necessary. 3. Create four sheets: a. Sum of Raw Materials Purchased. b. Count of Purchase Orders by Raw Material. c. Purchases by Day. d. Sum of Raw Materials Purchased by State. 4. Create a Dashboard with all four sheets. 5. Create dashboard-level fliters from the following two sheets: 0. Sum of Raw Materials Purchased. b. Sum of Raw Materials Purchased by State. Ask the Question: What are the different reports and charts that would be useful to place together for regular analysis? Master the Data: Open Tableau and Connect to Excel File Lab 10-2 Alt Data.xlsx. This dataset contains similar data to the 10-2 data, except it shows purchase orders, raw materials, and suppliers. Software needed - Tableau - Screen capture tool (Windows: Snlpping Tool; Mac: Cmd+Shift+4) Data: Lab 10-2 Alt Dato x15x. Perform the Analysis: Refer to Lab 10-2 Alternate in the text for instructions and Lab 10-2 steps for each the of lab parts. Share the Story: You have now created an interactive dashboard to analyze sales and product questions with this dataset. Required: 1. Which raw material is purchased most frequently from suppliers in Arkansas (AR)? Mait-WheatMalt-Barley Hops 2. Which raw material is purchased most frequently from suppliers in Washington? Malt - Barley Hops Malt - Wheat 3. On which day was the most Malt - Barley purchased from suppllers in Minnesota? December 1, 2019 February 21, 2019 December 4, 2019 January 31, 2019 4. From which state are most raw materials purchased, overall? Washington Nebraska Minnesota Arkansas 5. From which state are least raw materials purchased, overall? Arkansas Minnesota Washington Ractiace orter 10 A B c D 1 Raw_Materials_Code Raw_Materials_Description Raw_Materials_Price $19.99 $44.99 $29.00