Answered step by step
Verified Expert Solution
Question
1 Approved Answer
Required: 1 Using information in all the chapters in the textbook especially chapter 12, fill-in the formulas for the following ratios. 2 Calculate the

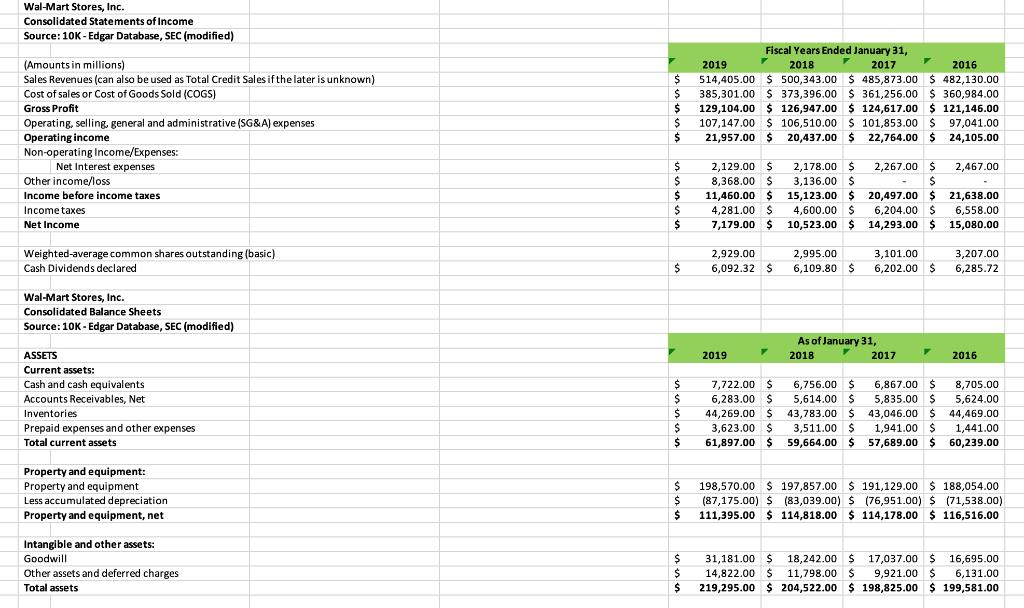
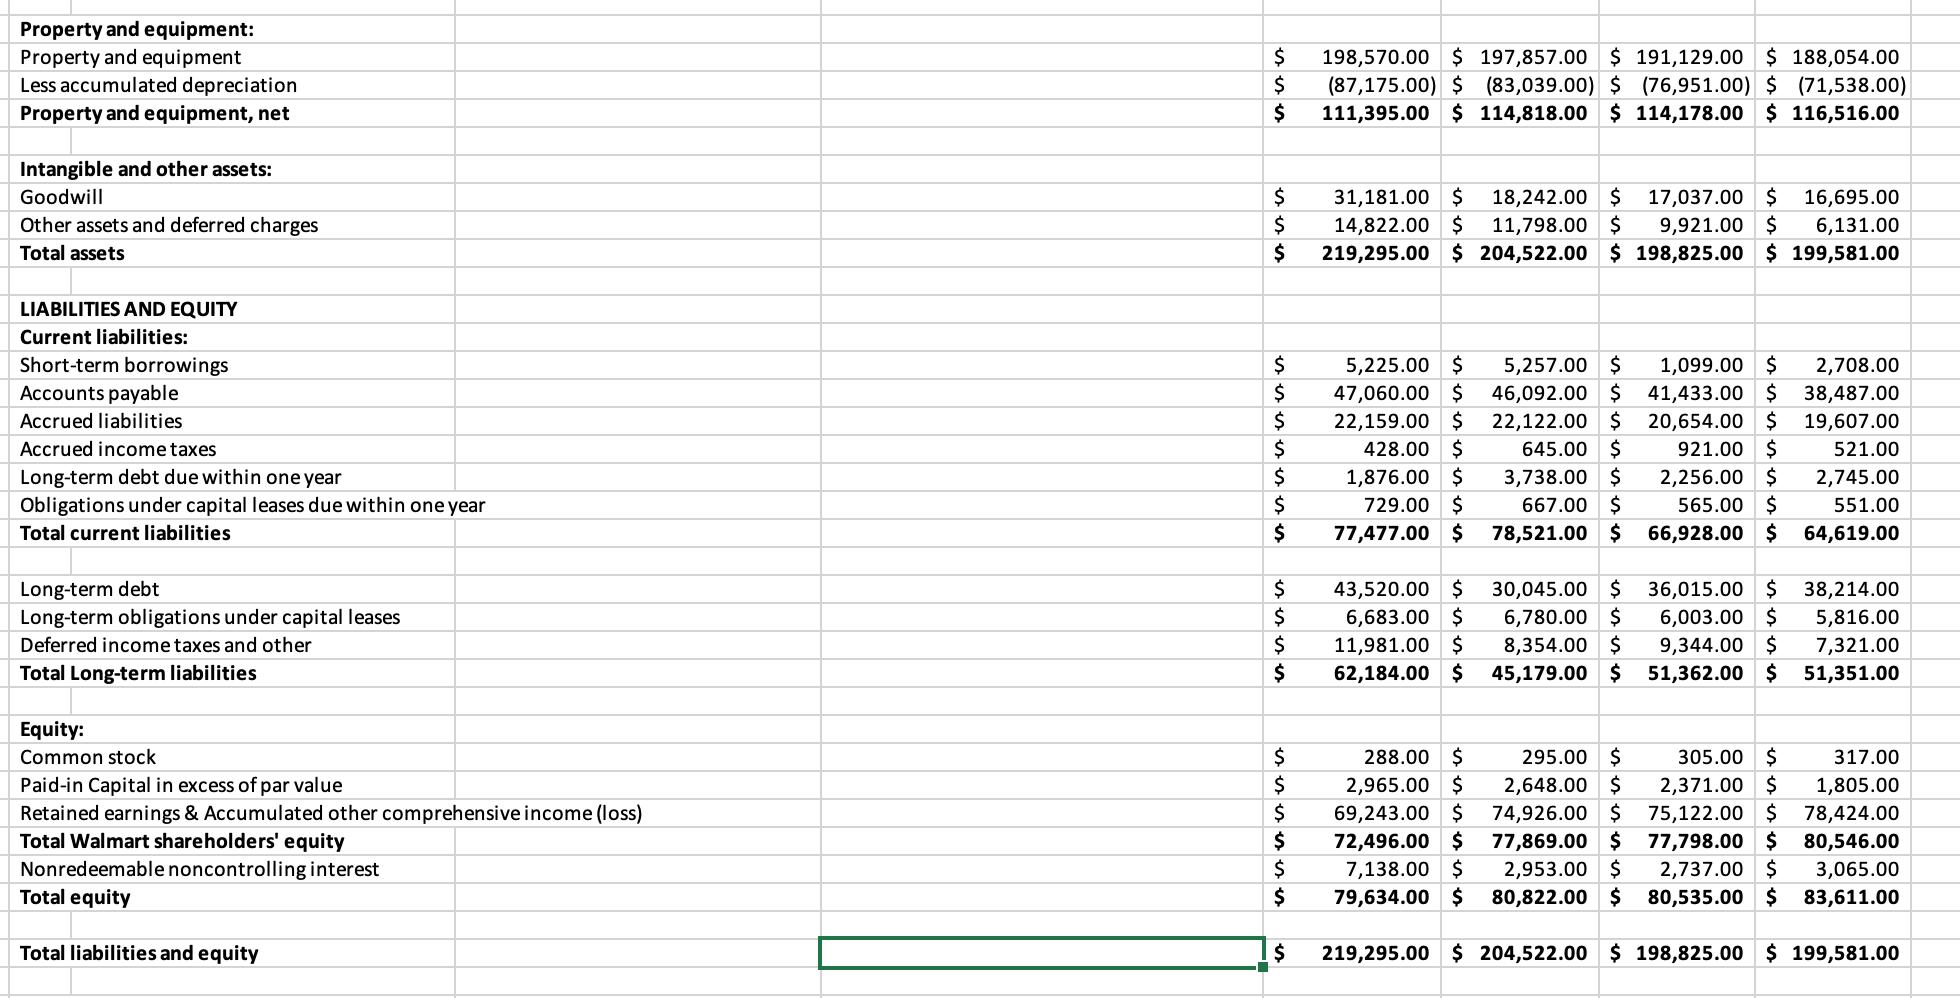
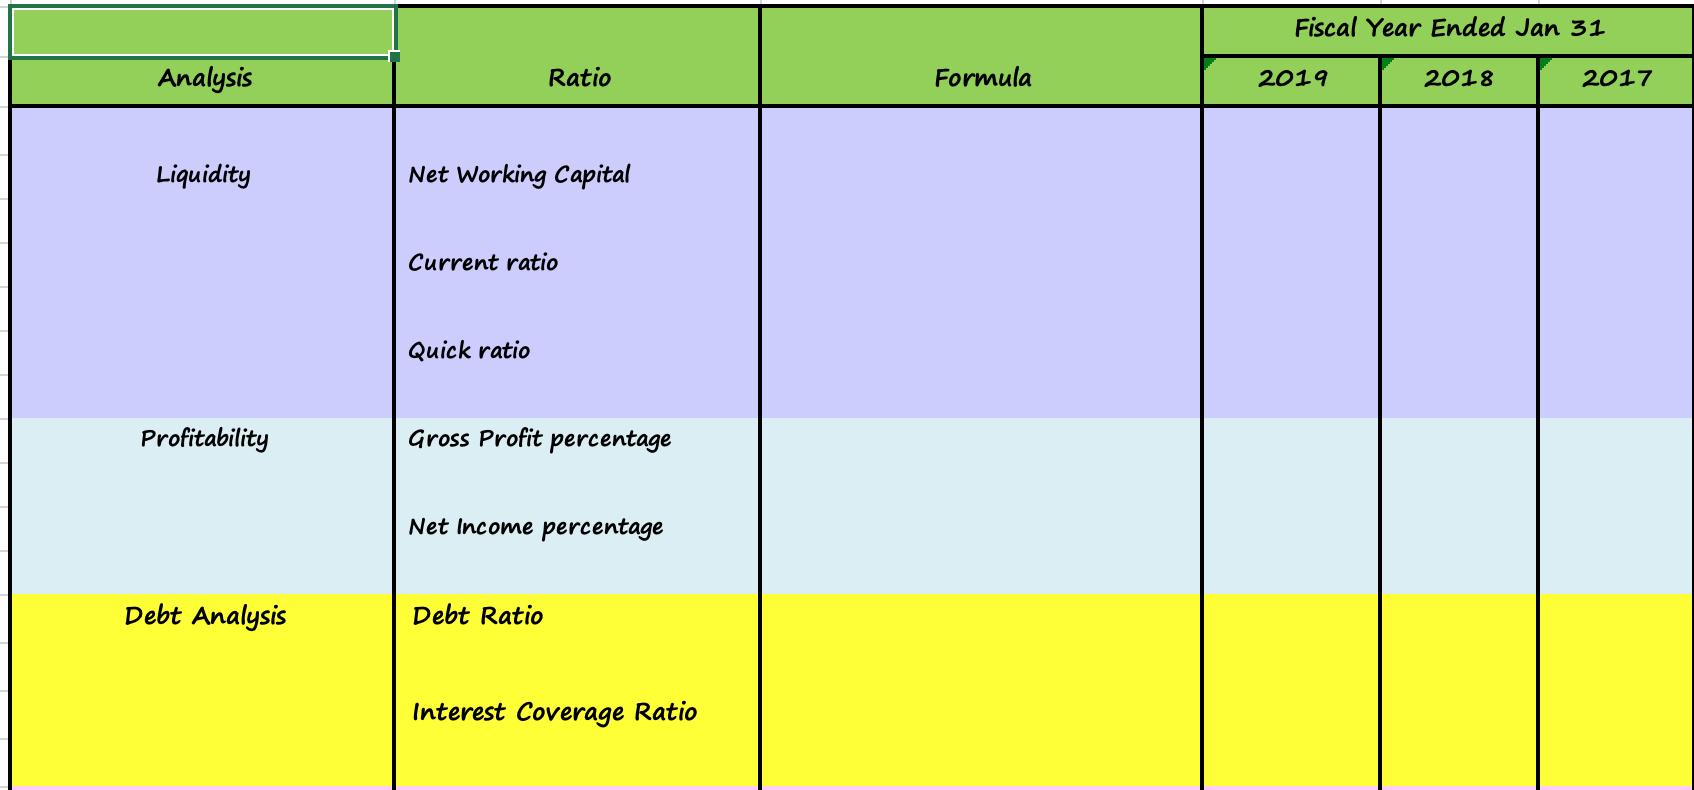
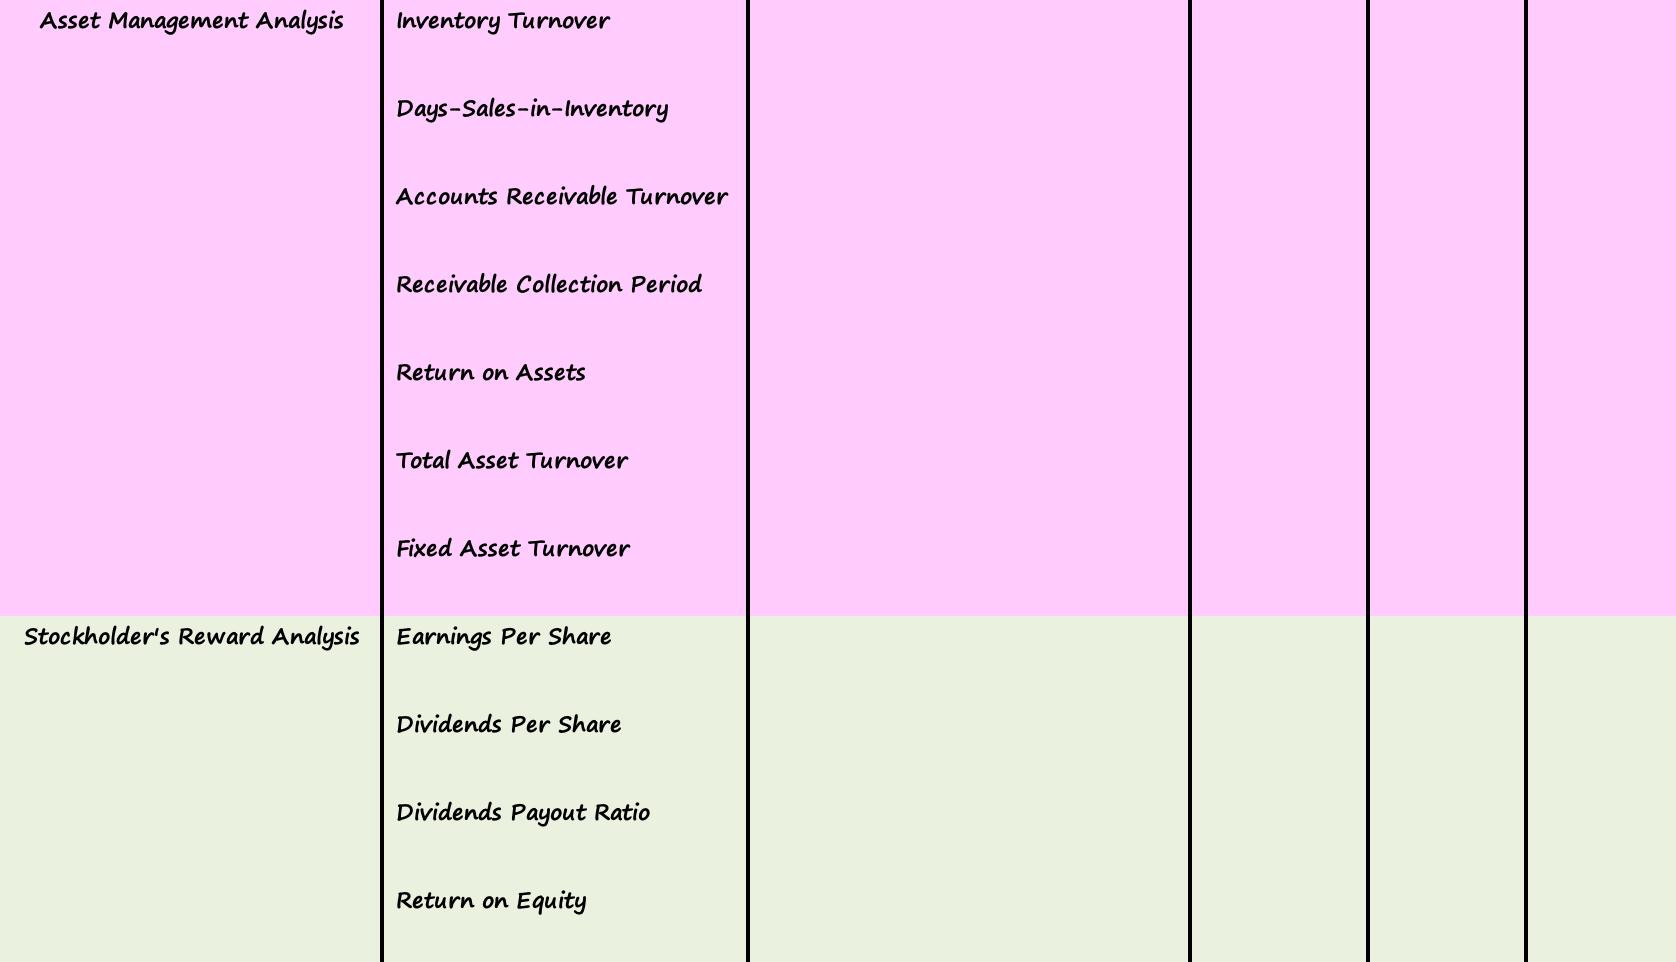
Required: 1 Using information in all the chapters in the textbook especially chapter 12, fill-in the formulas for the following ratios. 2 Calculate the ratios for Wal-Mart in 2019, 2018, and 2017 Fiscal years as provided in the table bellow. To prepare for the test, analyze the results (be able to explain what the numbers mean and compare between thetwo years) for various Liquidity, Profitability, Debt, Asset Management, and Stockholders' Reward ratios. 3 4 Take the Walmart FSA Project Test on the day as stated in the course schedule. 5 Be prepared to answer analytical questions using the ratios above like comparing the ratios in 2019, 2018, and 2017. Wal-Mart Stores, Inc. Consolidated Statements of Income Source: 10K - Edgar Database, SEC (modified) Fiscal Years Ended January 31, (Amounts in millions) Sales Revenues (can also be used as Total Credit Sales if the later is unknown) Cost of sales or Cost of Goods Sold (COGS) Gross Profit 2019 2018 2017 2016 514,405.00 $ 500,343.00 $ 485,873.00 $ 482,130.00 385,301.00 $ 373,396.00 $ 361,256.00 $ 360,984.00 129,104.00 $ 126,947.00 $ 124,617.00 $ 121,146.00 107,147.00 $ 106,510.00 $ 101,853.00 $ 97,041.00 21,957.00 $ 20,437.00 $ 22,764.00 $ 24,105.00 Operating, selling, general and administrative (SG&A) expenses Operating income Non-operating Income/Expenses: Net Interest expenses $ 2,178.00 $ 3,136.00 $ 15,123.00 $ 20,497.00 $ 4,600.00 $ 10,523.00 $ 14,293.00 $ 15,080.00 2,129.00 $ 2,267.00 $ 2,467.00 Other income/loss 8,368.00 $ 11,460.00 $ 4,281.00 $ 7,179.00 $ Income before income taxes 21,638.00 Incometaxes 6,204.00 $ 6,558.00 Net Income $ 2,929.00 6,092.32 $ 3,207.00 6,285.72 Weighted-average common shares outstanding (basic) 2,995.00 3,101.00 Cash Dividends declared 2$ 6,109.80 $ 6,202.00 S Wal-Mart Stores, Inc. Consolidated Balance Sheets Source: 10K - Edgar Database, SEC (modified) As of January 31, ASSETS 2019 2018 2017 2016 Current assets: Cash and cash equivalents 2$ 7,722.00 $ 6,283.00 $ 44,269.00 $ 3,623.00 $ 61,897.00 $ 6,756.00 $ 5,614.00 $ 43,783.00 $ 3,511.00 $ 59,664.00 $ 6,867.00 $ 5,835.00 $ 43,046.00 $ 8,705.00 Accounts Receivables, Net 5,624.00 Inventories 44,469.00 Prepaid expenses and other expenses 1,941.00 $ 57,689.00 $ 1,441.00 Total current assets 2$ 60,239.00 Property and equipment: 198,570.00 $ 197,857.00 $ 191,129.00 $ 188,054.00 (87,175.00) $ (83,039.00) $ (76,951.00) $ (71,538.00) $4 Property and eguipment Less accumulated depreciation Property and equipment, net 111,395.00 $ 114,818.00 $ 114,178.00 $ 116,516.00 Intangible and other assets: 18,242.00 $ 11,798.00 $ 219,295.00 $ 204,522.00 $ 198,825.00 $ 199,581.00 17,037.00 $ 9,921.00 $ 16,695.00 6,131.00 Goodwill 31,181.00 $ 2$ Other assets and deferred charges Total assets 14,822.00 $ Property and equipment: Property and equipment Less accumulated depreciation 198,570.00 $ 197,857.00 $ 191,129.00 $ 188,054.00 $ (87,175.00) $ (83,039.00) $ (76,951.00) $ (71,538.00) Property and equipment, net $ 111,395.00 $ 114,818.00 $ 114,178.00 $ 116,516.00 Intangible and other assets: 18,242.00 $ 11,798.00 $ 219,295.00 $ 204,522.00 $ 198,825.00 $ 199,581.00 $ 31,181.00 $ 14,822.00 $ Goodwill 17,037.00 $ 16,695.00 Other assets and deferred charges 9,921.00 $ 6,131.00 Total assets LIABILITIES AND EQUITY Current liabilities: 5,225.00 $ 47,060.00 $ 22,159.00 $ 428.00 $ 1,099.00 $ 41,433.00 $ Short-term borrowings 5,257.00 $ 2,708.00 Accounts payable 46,092.00 $ 22,122.00 $ 645.00 $ 38,487.00 20,654.00 $ 921.00 $ Accrued liabilities 19,607.00 Accrued income taxes 521.00 Long-term debt due within one year Obligations under capital leases due within one year 1,876.00 $ 729.00 $ 3,738.00 $ 2,256.00 $ 2,745.00 667.00 2$ 565.00 $ 551.00 Total current liabilities $ 77,477.00 $ 78,521.00 $ 66,928.00 $ 64,619.00 Long-term debt Long-term obligations under capital leases 43,520.00 $ 6,683.00 $ 11,981.00 $ 30,045.00 $ 6,780.00 $ 8,354.00 $ 36,015.00 $ 6,003.00 $ 9,344.00 $ 38,214.00 5,816.00 Deferred income taxes and other 7,321.00 Total Long-term liabilities $ 62,184.00 $ 45,179.00 $ 51,362.00 $ 51,351.00 Equity: $ $ 2,648.00 $ 74,926.00 $ 77,869.00 $ 2,953.00 $ 80,822.00 $ 80,535.00 $ 83,611.00 Common stock 288.00 295.00 $ 305.00 $ 317.00 Paid-in Capital in excess of par value 2,965.00 $ 2,371.00 $ 1,805.00 Retained earnings & Accumulated other comprehensive income (loss) Total Walmart shareholders' equity Nonredeemable noncontrolling interest Total equity 69,243.00 $ 72,496.00 $ 7,138.00 $ 79,634.00 $ 75,122.00 $ 77,798.00 $ 2,737.00 $ 78,424.00 80,546.00 3,065.00 $ Total liabilities and equity $ 219,295.00 $ 204,522.00 $ 198,825.00 $ 199,581.00 Fiscal Year Ended Jan 31 Analysis Ratio Formula 2019 2018 2017 Liquidity Net Working Capital Current ratio Quick ratio Profitability Gross Profit percentage Net Income percentage Debt Analysis Debt Ratio Interest Coverage Ratio Asset Management Analysis Inventory Turnover Days-Sales-in-Inventory Accounts Receivable Turnover Receivable Collection Period Return on Assets Total Asset Turnover Fixed Asset Turnover Stockholder's Reward Analysis Earnings Per Share Dividends Per Share Dividends Payout Ratio Return on Equity
Step by Step Solution
★★★★★
3.48 Rating (151 Votes )
There are 3 Steps involved in it
Step: 1
Analysis Ratios formula 2019 2018 2017 Liquidity n...
Get Instant Access to Expert-Tailored Solutions
See step-by-step solutions with expert insights and AI powered tools for academic success
Step: 2

Step: 3

Ace Your Homework with AI
Get the answers you need in no time with our AI-driven, step-by-step assistance
Get Started


