

Answered step by step
Verified Expert Solution
Question
1 Approved Answer
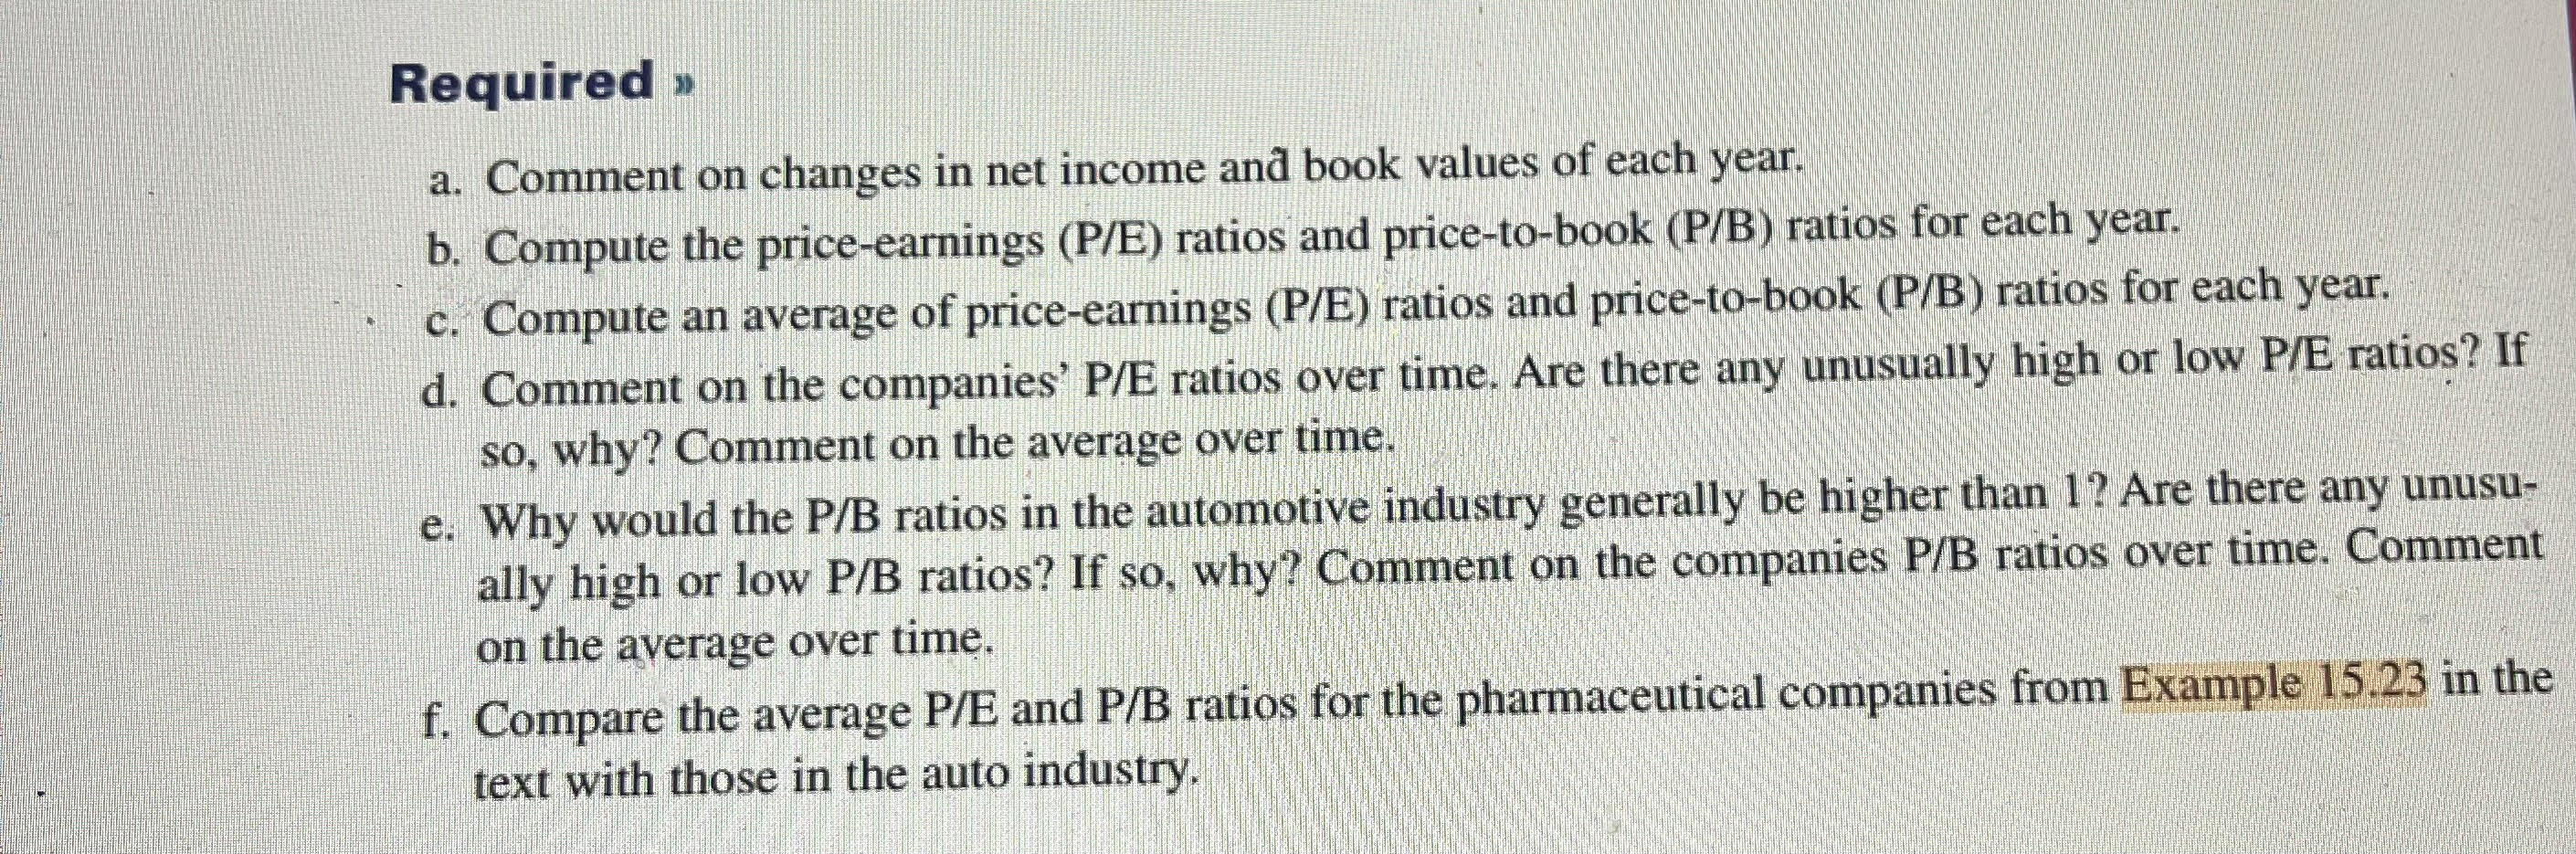
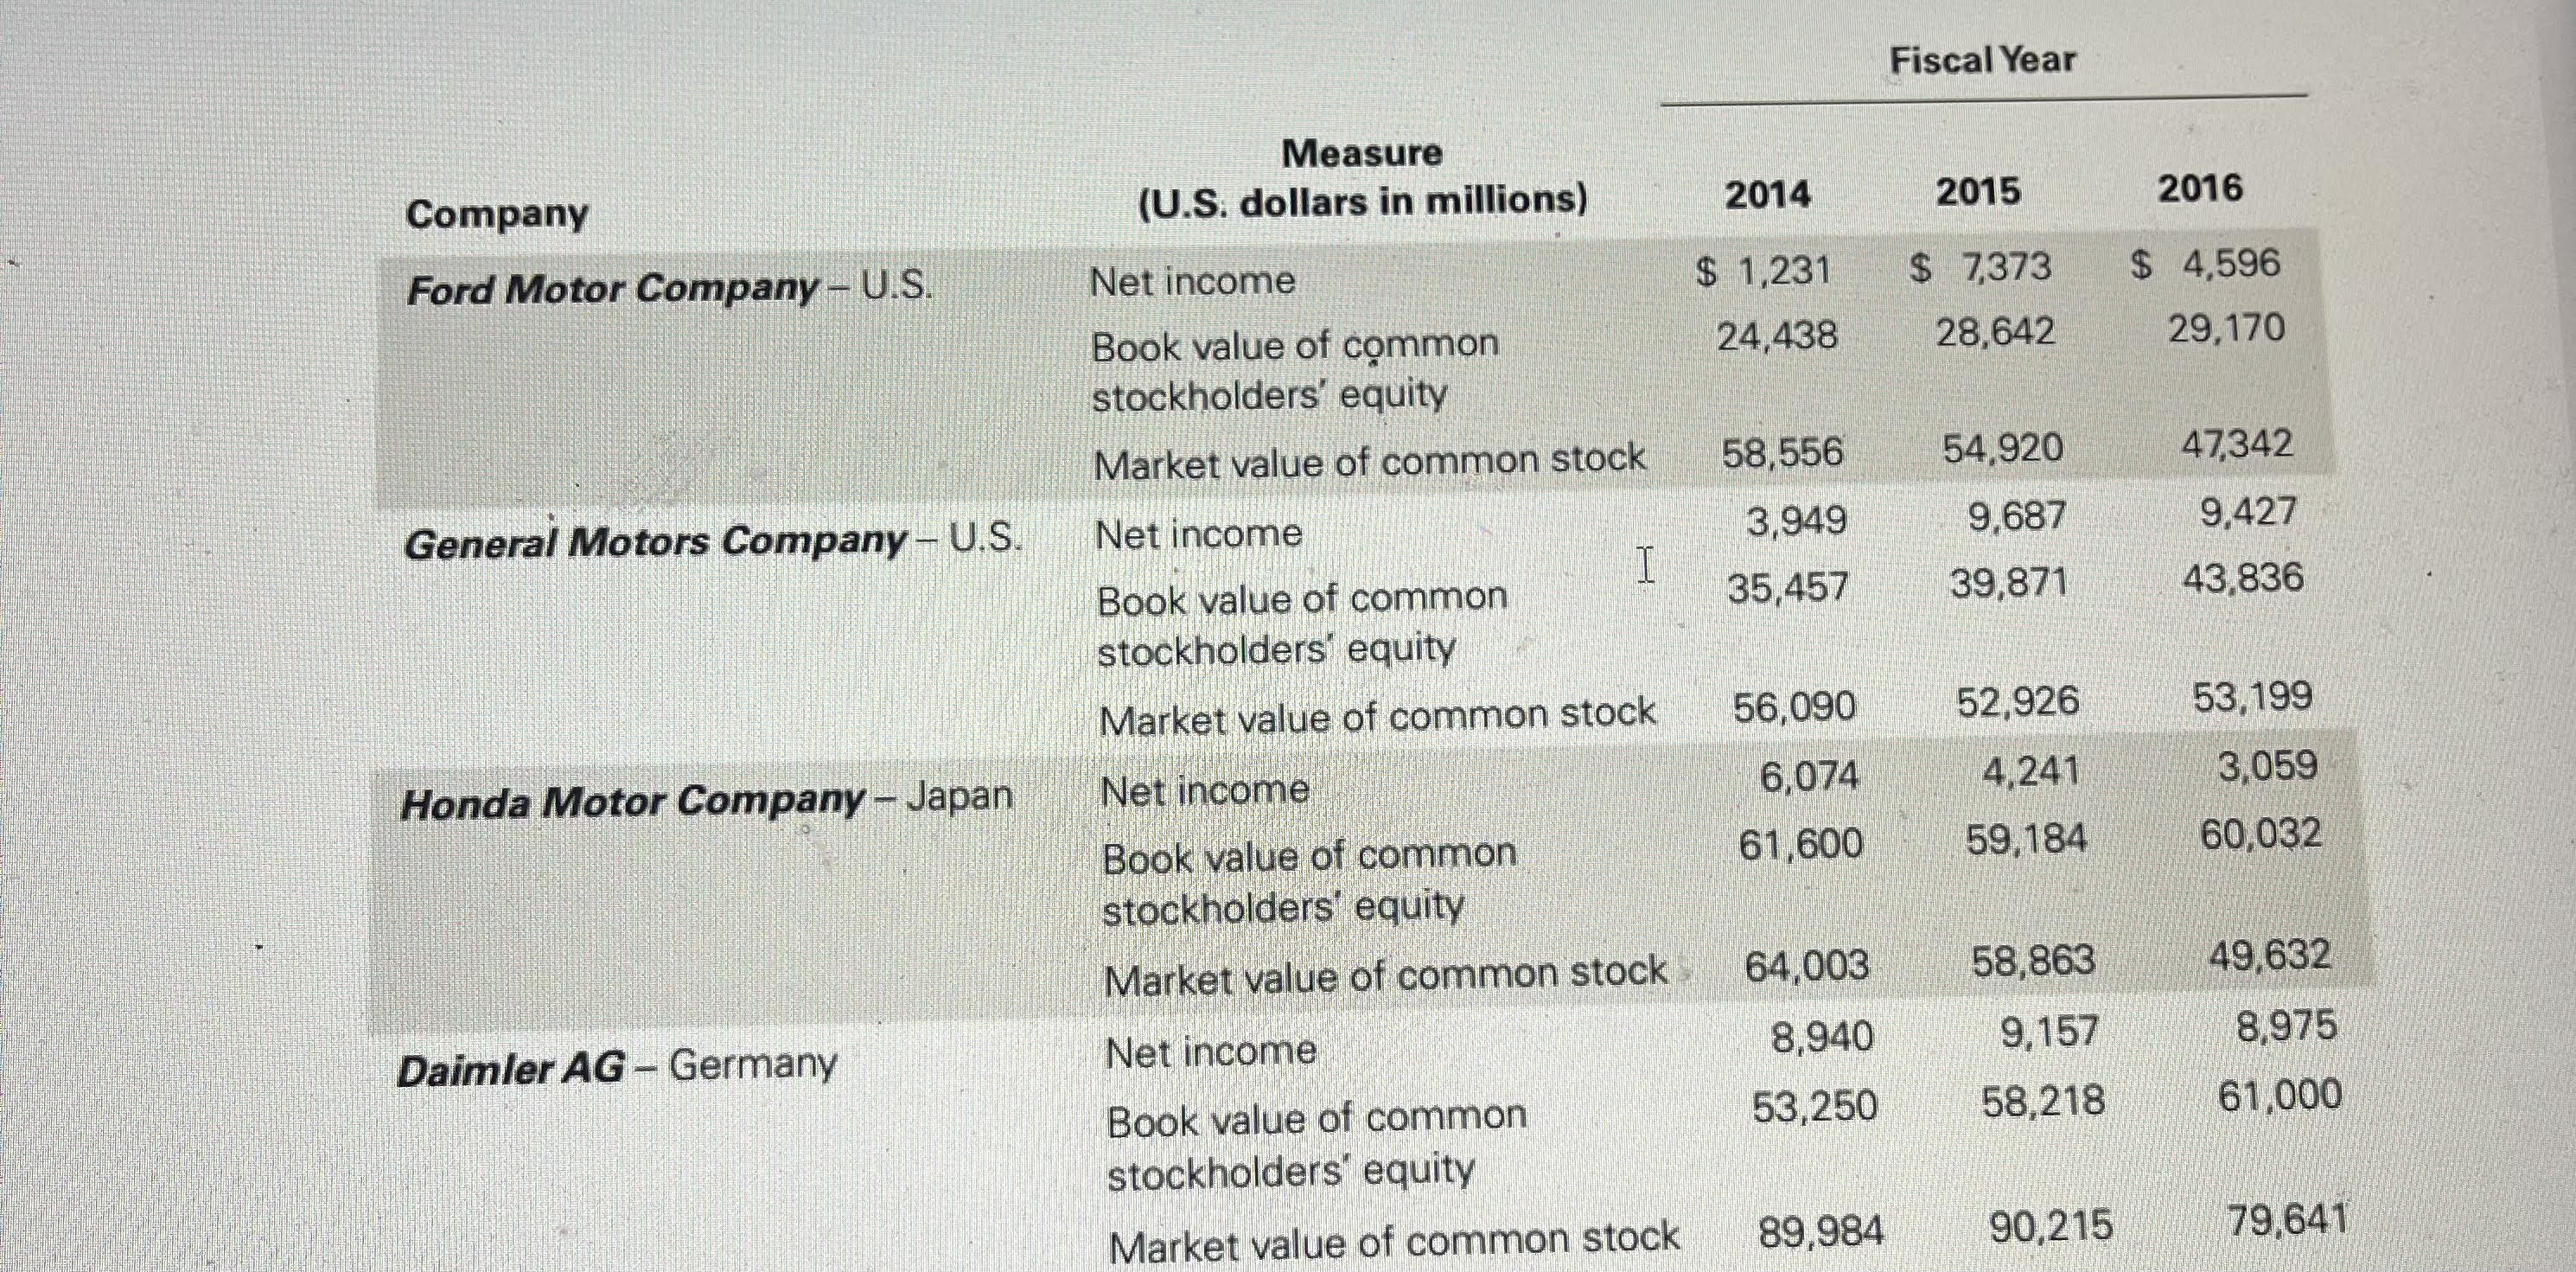
Required > a. Comment on changes in net income and book values of each year. b. Compute the price-earnings (P/E) ratios and price-to-book (P/B) ratios

Step by Step Solution
There are 3 Steps involved in it
Step: 1

Get Instant Access to Expert-Tailored Solutions
See step-by-step solutions with expert insights and AI powered tools for academic success
Step: 2

Step: 3
Ace Your Homework with AI
Get the answers you need in no time with our AI-driven, step-by-step assistance
Get Started
Financial Accounting
Authors: Jerry J. Weygandt, Paul D. Kimmel, Donald E. Kieso
7th Edition
978-0470477151, 978-0-470-5562, 470556242, 0-470-55624-2, 9780470556245, 978-0470507018