

Question
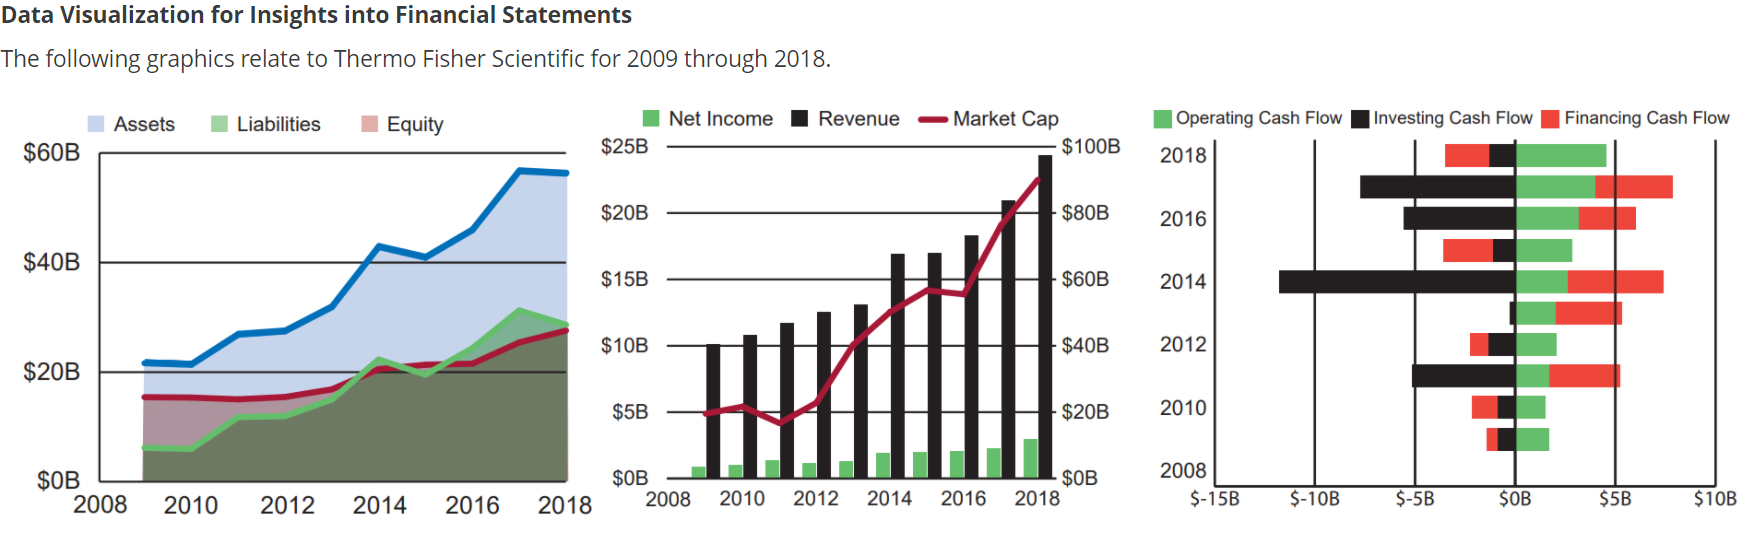
Required a. The graphic on the left shows balance sheet data. i. Which year has the largest assets? ii. What general trend do we observe
Required
a. The graphic on the left shows balance sheet data. i. Which year has the largest assets?
ii. What general trend do we observe for Thermo Fishers assets?
iii. Which tracks more closely with total assets: liabilities or equity?
iv. Over the 10year period, how often did liabilities exceed equity? Enter the total number of years liabilities exceeded equity during the 10-year period
b. The middle graphic shows income statement data and Thermo Fishers market capitalization (the value of all the companys stock) each year. i. From 2009 to 2017, revenue roughly doubled from $10,110 million to $20,918 million. What was the growth in net income over that period? Compute net income growth as a percentage. Round answer to one decimal place (ex: 1.2345 = 123.5%).
ii. What general pattern do we observe for revenue?
iii. Which year had the biggest percentage increase in revenue?
iv. Which year has a better profit margin (PM), 2017 or 2018?
v. What is the companys market cap in 2018?
c. The graphic on the right shows cash flow data. i. Which year has the smallest operating cash flow?
ii. In how many years were financing cash flows negative?
iii. In all years but one, cumulative positive cash flows were about equal to cumulative negative cash flows. What year was the exception?
d. Use data from the left and middle graphics to calculate return on assets (ROA) and return on equity (ROE) for 2018. Round your answers to one decimal place (ex: 0.2345 = 23.5%).
| ROA | ROE |
|---|---|
|
|
Step by Step Solution
There are 3 Steps involved in it
Step: 1

Get Instant Access to Expert-Tailored Solutions
See step-by-step solutions with expert insights and AI powered tools for academic success
Step: 2

Step: 3
Ace Your Homework with AI
Get the answers you need in no time with our AI-driven, step-by-step assistance
Get Started
ISO IEC 27002 2022 Auditors Handbook A Comprehensive Resource For Auditing Of ISO IEC 27002 Information Security, Cybersecurity And Privacy Controls
Authors: Oliver Gruhn-van Dorp
1st Edition
B0CHKY19X2, 979-8858543510