Answered step by step
Verified Expert Solution
Question
1 Approved Answer
Required: a) Write a short report that identifies the strengths and weaknesses of the company as revealed by this five-year summary. [30 marks] b) Discuss


Required:
a) Write a short report that identifies the strengths and weaknesses of the company as revealed by this five-year summary.
[30 marks]
b) Discuss the benefits and limitations of ratio analysis.
[20 marks] [Total 50 marks]
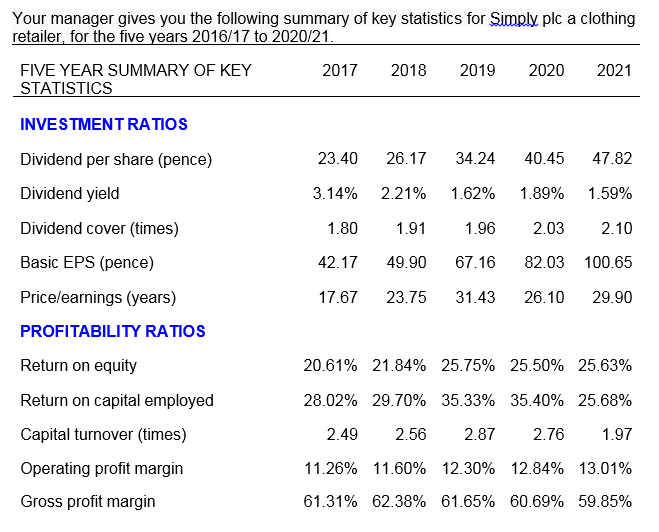
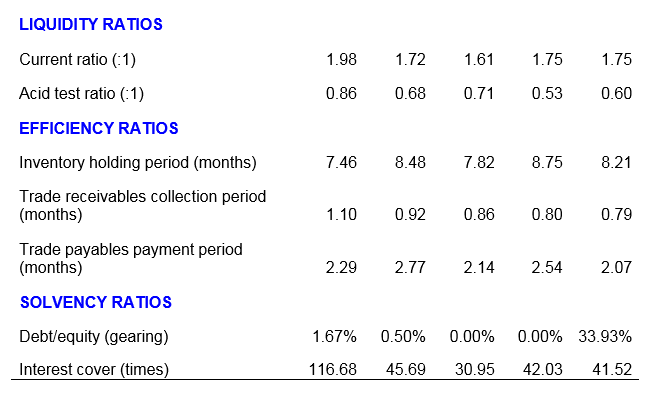
Your manager gives you the following summary of key statistics for Simply plc a clothing retailer, for the five years 2016/17 to 2020/21. FIVE YEAR SUMMARY OF KEY 2017 2018 2019 2020 2021 STATISTICS INVESTMENT RATIOS 23.40 26.17 34.24 40.45 47.82 Dividend per share (pence) Dividend yield 3.14% 2.21% 1.62% 1.89% 1.59% 1.80 1.91 1.96 2.03 2.10 Dividend cover (times) Basic EPS (pence) 42.17 49.90 67.16 82.03 100.65 17.67 23.75 31.43 26.10 29.90 Pricelearnings (years) PROFITABILITY RATIOS Return on equity Return on capital employed 20.61% 21.84% 25.75% 25.50% 25.63% 28.02% 29.70% 35.33% 35.40% 25.68% 2.49 2.56 2.87 2.76 1.97 Capital turnover (times) Operating profit margin Gross profit margin 11.26% 11.60% 12.30% 12.84% 13.01% 61.31% 62.38% 61.65% 60.69% 59.85% LIQUIDITY RATIOS 1.98 1.72 1.61 1.75 1.75 0.86 0.68 0.71 0.53 0.60 7.46 8.48 7.82 8.75 8.21 Current ratio (:1) Acid test ratio (:1) EFFICIENCY RATIOS Inventory holding period (months) Trade receivables collection period (months) Trade payables payment period (months) SOLVENCY RATIOS Debt/equity (gearing) Interest cover (times) 1.10 0.92 0.86 0.80 0.79 2.29 2.77 2.14 2.54 2.07 1.67% 0.50% 0.00% 0.00% 33.93% 116.68 45.69 30.95 42.03 41.52
Step by Step Solution
There are 3 Steps involved in it
Step: 1

Get Instant Access to Expert-Tailored Solutions
See step-by-step solutions with expert insights and AI powered tools for academic success
Step: 2

Step: 3

Ace Your Homework with AI
Get the answers you need in no time with our AI-driven, step-by-step assistance
Get Started


