Answered step by step
Verified Expert Solution
Question
1 Approved Answer
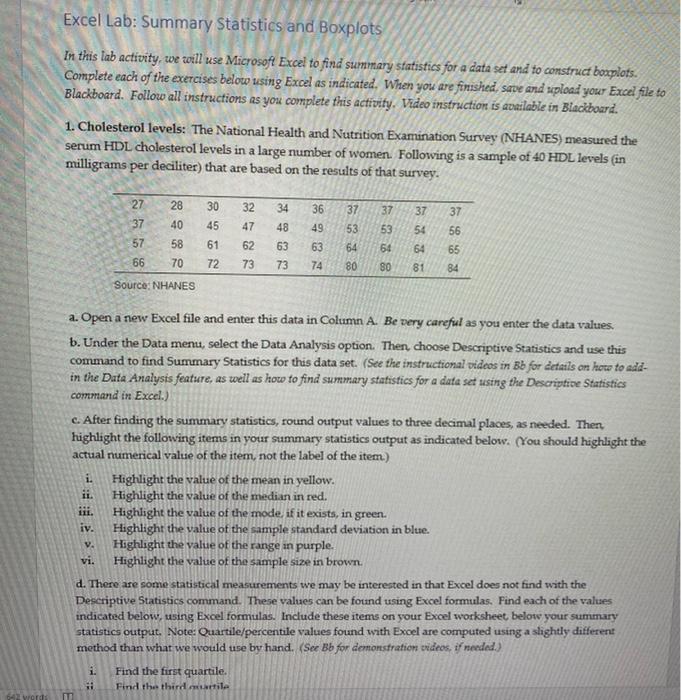
Required: Calculate summary statistics using the Excel Analysis ToolPak. Create a box plot to show the distribution of the online and in - person sale
Required:
Calculate summary statistics using the Excel Analysis ToolPak.
Create a box plot to show the distribution of the online and inperson sale transactions.
Data: Lab Data.xlsx
Specify the Question: What are the descriptive statistics for online and inperson sales? What does the distribution of the transaction amount look like? Based on the descriptive statistics and box plot, how do the online and inperson sales compare?
Obtain the Data: This lab uses the data in Lab Data.xlsx This dataset is a condensed version of Fruity Fruits sales data that show the sales earned for each transaction and the transaction type online or inperson
Analyze the Data: Refer to lab in your text for additional instructions and steps.

Step by Step Solution
There are 3 Steps involved in it
Step: 1

Get Instant Access to Expert-Tailored Solutions
See step-by-step solutions with expert insights and AI powered tools for academic success
Step: 2

Step: 3

Ace Your Homework with AI
Get the answers you need in no time with our AI-driven, step-by-step assistance
Get Started


