

Question
Required: Carry out a structural analysis of both the income statement and balance sheet position for the last two years using index numbers and comment
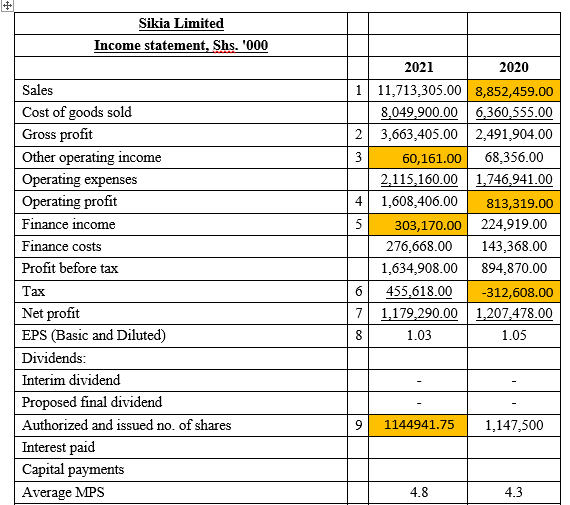
Required: Carry out a structural analysis of both the income statement and balance sheet position for the last two years using index numbers and comment on the results.
| Consolidated Balance Sheet |
|
|
| |
|
|
| 2021 | 2020 | |
| Capital employed: |
|
|
| |
| Share capital |
| 2,295,000.00 | 2,295,000.00 | |
| Revaluation surplus | 10 | 1,151,885.00 | 1,265,438.00 | |
| Retained earnings |
| 4,803,005.00 | 3,969,164.00 | |
| Shareholder's funds | 11 | 8,249,890.00 | 7,529,602.00 | |
|
|
|
|
| |
| Represented by: |
|
|
| |
| Non-current assets: |
|
|
| |
| Property, plant and equipment |
| 8,689,465.00 | 9,073,839.00 | |
| Intangible assets | 12 | 107,159.00 | 139,652.00 | |
| Development costs |
| - | - | |
| Non-current assets held for sale |
| 8,288.00 | 9,071.00 | |
| Non-current receivables |
| 73,795.00 | 59,346.00 | |
|
|
| 8,878,707.00 | 9,281,908.00 | |
| Non-current Liabilities: |
|
|
| |
| Deferred tax | 13 | 1,384,651.00 | 929,033.00 | |
| Provision for gratuity |
| 14,850.00 | 12,448.00 | |
| Deferred Grant income |
| 19,320.00 | 28,340.00 | |
| Long term borrowings | 14 | 1,644,357.00 | 1,787,111.00 | |
|
|
| 3,063,178.00 | 2,756,932.00 | |
| Current assets; |
|
|
| |
| Inventories |
| 716,309.00 | 597,072.00 | |
| Biological assets |
| 134,533.00 | 142,130.00 | |
| Trade and other receivables | 15 | 2,495,433.00 | 2,447,201.00 | |
| Taxation recoverable |
| 300,976.00 | 297,024.00 | |
| Collateral deposit |
| 215,032.00 | 204,669.00 | |
| Deposits with financial institutions |
| 615,282.00 | - | |
| Cash and cash equivalents |
| 394,313.00 | 136,786.00 | |
|
| 16 | 4,871,878.00 | 3,824,882.00 | |
| Current Liabilities: |
|
|
| |
| Borrowings |
| 252,978.00 | 673,048.00 | |
| Payables and accrued expenses | 17 | 1,925,619.00 | 1,881,833.00 | |
| Provision for service gratuity |
| 4,856.00 | 3,341.00 | |
| Taxation payable |
| - | - | |
| Provision for staff leave pay | 18 | 22,109.00 | 21,118.00 | |
| Unclaimed dividends |
| 231,955.00 | 240,916.00 | |
|
|
| 2,437,517.00 | 2,820,256.00 | |
| Net current assets | 19 | 2,434,361.00 | 2,820,256.00 | |
|
| 20 | 5,497,539.00 | 3,761,558.00 | |
# Sikia Limited Income statement, Shs. '000 Sales Cost of goods sold Gross profit Other operating income Operating expenses Operating profit Finance income Finance costs Profit before tax Tax Net profit EPS (Basic and Diluted) Dividends: Interim dividend Proposed final dividend Authorized and issued no. of shares Interest paid Capital payments Average MPS 2021 2020 1 11,713,305.00 8,852,459.00 8,049,900.00 6,360,555.00 23,663,405.00 2,491,904.00 3 60,161.00 68,356.00 2,115,160.00 1,746,941.00 4 1,608,406.00 813,319.00 5 303,170.00 224,919.00 276,668.00 143,368.00 1,634,908.00 894,870.00 455.618.00 -312,608.00 7 1,179,290.00 1,207,478.00 8 1.03 1.05 6 9 1144941.75 1,147,500 4.8 4.3 # Sikia Limited Income statement, Shs. '000 Sales Cost of goods sold Gross profit Other operating income Operating expenses Operating profit Finance income Finance costs Profit before tax Tax Net profit EPS (Basic and Diluted) Dividends: Interim dividend Proposed final dividend Authorized and issued no. of shares Interest paid Capital payments Average MPS 2021 2020 1 11,713,305.00 8,852,459.00 8,049,900.00 6,360,555.00 23,663,405.00 2,491,904.00 3 60,161.00 68,356.00 2,115,160.00 1,746,941.00 4 1,608,406.00 813,319.00 5 303,170.00 224,919.00 276,668.00 143,368.00 1,634,908.00 894,870.00 455.618.00 -312,608.00 7 1,179,290.00 1,207,478.00 8 1.03 1.05 6 9 1144941.75 1,147,500 4.8 4.3
Step by Step Solution
There are 3 Steps involved in it
Step: 1

Get Instant Access to Expert-Tailored Solutions
See step-by-step solutions with expert insights and AI powered tools for academic success
Step: 2

Step: 3
Ace Your Homework with AI
Get the answers you need in no time with our AI-driven, step-by-step assistance
Get Started
Understanding The Polish Capital Market From Emerging To Developed
Authors: Marek Dietl, Dariusz Zarzecki
1st Edition
1032286962, 978-1032286969