

Required discussion post centers on three scenarios for social security administration (SSA) retirement benefits. These benefits increase yearly by the amount of inflation (i%): Retire
Required discussion post centers on three scenarios for social security administration (SSA) retirement benefits. These benefits increase yearly by the amount of inflation (i%):
- Retire at 66 and receive full SSA retirement benefits.
- Retire at 62, and receive 25% reduced SSA retirement benefits with limits on how much you can earn
- Retire at 70 and receive 25% increased SSA retirement benefits
Note that the average retirement benefits for an engineering manager working 40 years is around $30,000/year and current interest rate increase per year is less than 1%. However, the decision is immaterial to the benefit amount, so you can actually use $1 as your basis in making the decision.
The goal is to determine which scenario is better, assuming that each potential retiree has two constraints to think about:
- How long are they expected to live (average age for Males is 78 and females is 82) depending on their current health before retiring?
- What is the expected rate of inflation?
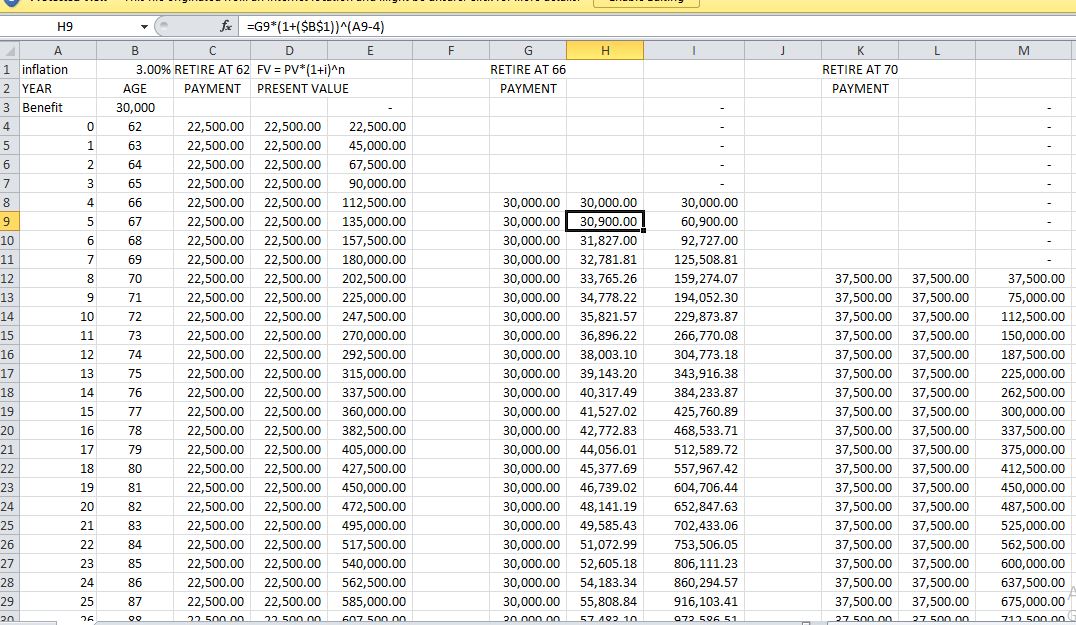
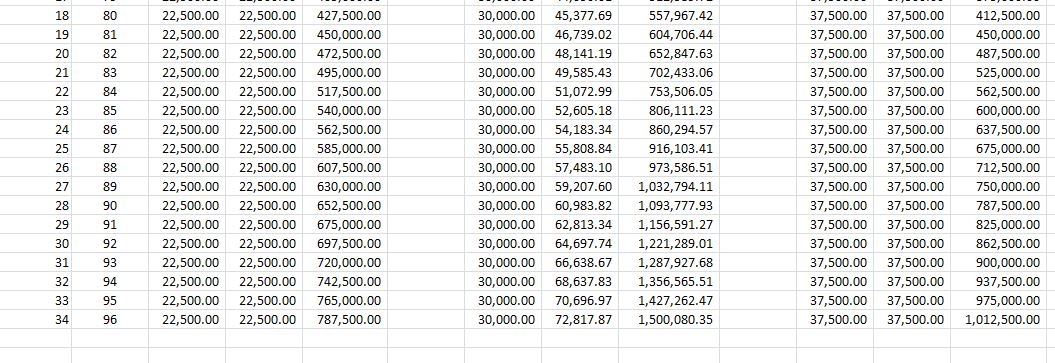
I attached an Excel sheet based starting scenario to help in post 2. It assumes no inflation rate for ages 62 and 70, but shows how to perform analysis for age 66, and show three crossover points (for 0% interest they are 62/66 at 78 years of age, 62/70 at 81 years and 66/70 at 82 years. Use it as guide to change the analysis for ages 62 and 70). You can update it either for PV or FV, not both
USE FV TAB IN EXCEL, ITS EASIER. Dont use PV
To add inflation rate (i%) to the decision, you can convert each year benefit by using either Present Value (PV) or Future Value (FV) to each year of the benefit on a yearly basis then add the years to make the crossover comparison in a third Excel column, using either the ROI tables or the formula
FV = PV * (1+i)n. The higher the inflation rate the larger (older) crossover age is, since $$ in the future are worth less in todays dollars. I find it easier to use FV, which shows expanding up curves. PV shows leveling off curves.
In the given Excel example, Please note that Present/Future Values for ages 62 (column D) and 70 (Column M) are not calculated using the inflation rate like the Present/Future Value is for age 66 (Column H).
If you use PV, then you have to make sure to bring the first and subsequent years for ages 66 and 70 to PV. If you use FV, then you do not have to bring all years to PV and just plug in the FV formula to each year then add up the benefits (Please have the same n for all three scenarios, starting with n = 0 for age 62, and n = 4 for age 66 and n=8 for 70 yeas). The crossovers will be the same for using either PV or FV as described.
If you are really ambitious, then you can use P/A or F/A from the ROI table. This way you can eliminate the third addition column for each year and compare the three scenarios directly
starting salary is $21900 and yearly inflation rate is. 2.1% for (i%)
Step by Step Solution
There are 3 Steps involved in it
Step: 1

See step-by-step solutions with expert insights and AI powered tools for academic success
Step: 2

Step: 3
Ace Your Homework with AI
Get the answers you need in no time with our AI-driven, step-by-step assistance
Get Started
Authors: Greg Middleton
1st Edition
979-8866955046