REQUIRED: Identify the errors in the notes and correct them. Specifically: - If a wrong statement is made in a sentence, provide a correct sentence. - If there is a wrong result of a calculation, do the calculation by yourself and provide the correct result.


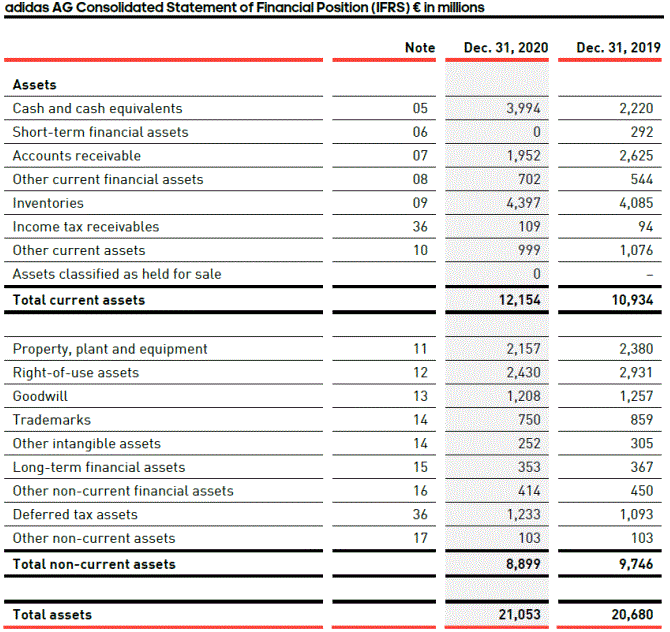
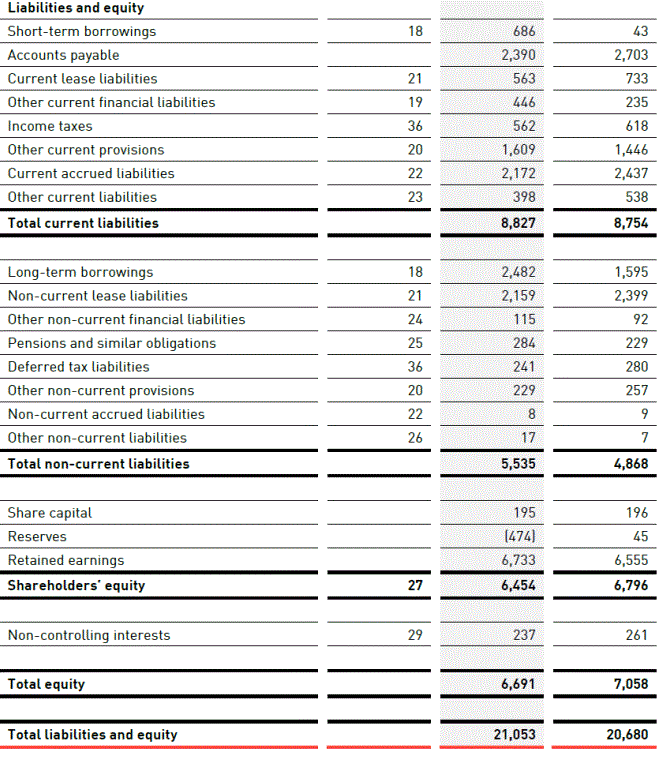
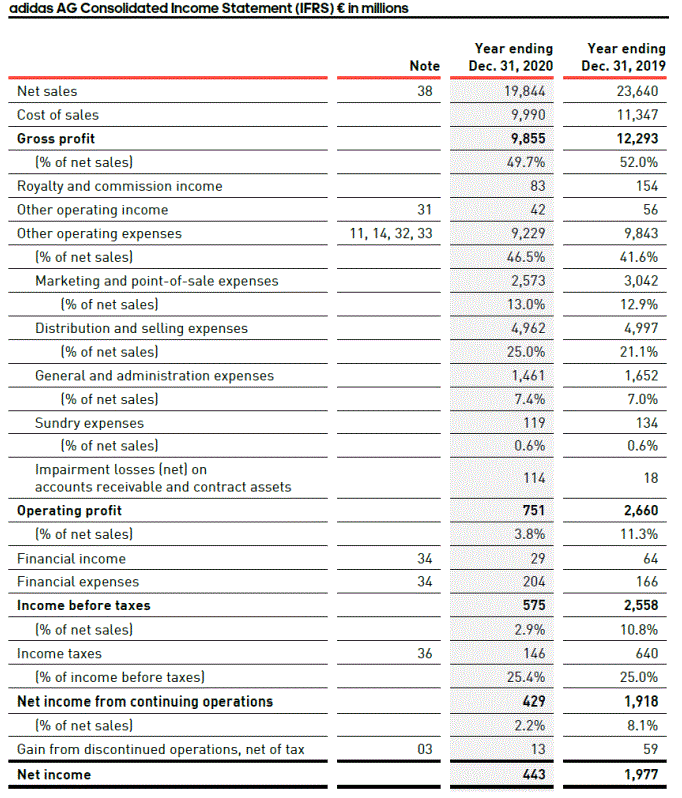
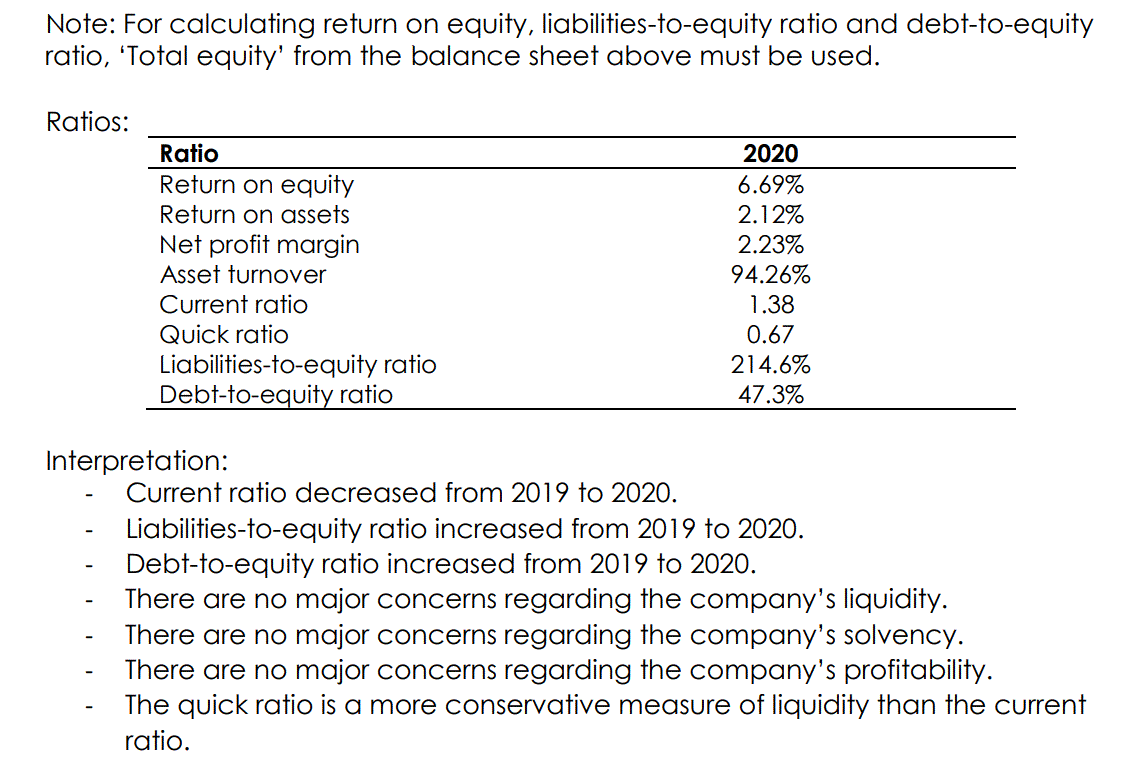
adidas AG Consolidated Statement of Financial Position (IFRS) in millions Note Dec. 31, 2020 Dec. 31, 2019 Assets Cash and cash equivalents Short-term financial assets Accounts receivable Other current financial assets Inventories Income tax receivables Other current assets Assets classified as held for sale Total current assets 05 06 07 08 09 36 10 3,994 2,220 0 292 1,952 2,625 702 544 4,397 4,085 109 94 999 1,076 0 12,154 10,934 11 12 13 14 14 Property, plant and equipment Right-of-use assets Goodwill Trademarks Other intangible assets Long-term financial assets Other non-current financial assets Deferred tax assets Other non-current assets Total non-current assets 2,157 2,430 1,208 750 252 353 414 1,233 103 2,380 2,931 1,257 859 305 367 450 1,093 103 9,746 15 16 36 17 8,899 Total assets 21,053 20,680 18 43 Liabilities and equity Short-term borrowings Accounts payable Current lease liabilities Other current financial liabilities Income taxes Other current provisions Current accrued liabilities Other current liabilities Total current liabilities 21 19 36 20 22 23 686 2,390 563 446 562 1,609 2,172 398 2,703 733 235 618 1,446 2,437 538 NIX 8,827 8,754 Long-term borrowings Non-current lease liabilities Other non-current financial liabilities Pensions and similar obligations Deferred tax liabilities Other non-current provisions Non-current accrued liabilities Other non-current liabilities Total non-current liabilities 18 21 24 25 36 20 22 26 2,482 2,159 115 284 241 229 1,595 2,399 92 229 280 257 9 7 8 17 5,535 4,868 Share capital Reserves Retained earnings Shareholders' equity 195 (474) 6,733 196 45 6,555 6,796 27 6,454 Non-controlling interests 29 237 261 Total equity 6,691 7,058 Total liabilities and equity 21,053 20,680 adidas AG Consolidated Income Statement (IFRS) in millions Note 38 Year ending Dec. 31, 2020 19,844 9,990 9,855 49.7% 83 42 31 11, 14, 32, 33 Net sales Cost of sales Gross profit % of net sales) Royalty and commission income Other operating income Other operating expenses % of net sales) Marketing and point-of-sale expenses (% of net sales) Distribution and selling expenses % of net sales) General and administration expenses (% of net sales) Sundry expenses % of net sales) Impairment losses (net) on accounts receivable and contract assets Operating profit % of net sales) Financial income Financial expenses Income before taxes 1% of net sales) Income taxes % of income before taxes) Net income from continuing operations % of net sales) Gain from discontinued operations, net of tax Net income 9,229 46.5% 2,573 13.0% 4,962 25.0% 1,461 7.4% 119 0.6% Year ending Dec. 31, 2019 23,640 11,347 12,293 52.0% 154 56 9,843 41.6% 3,042 12.9% 4,997 21.1% 1,652 7.0% 134 0.6% 114 18 751 3.8% 29 204 34 34 575 2,660 11.3% 64 166 2,558 10.8% 640 25.0% 1,918 8.1% 59 1,977 2.9% 146 25.4% 429 2.2% 36 03 13 443 Note: For calculating return on equity, liabilities-to-equity ratio and debt-to-equity ratio, 'Total equity' from the balance sheet above must be used. Ratios: Ratio Return on equity Return on assets Net profit margin Asset turnover Current ratio Quick ratio Liabilities-to-equity ratio Debt-to-equity ratio 2020 6.69% 2.12% 2.23% 94.26% 1.38 0.67 214.6% 47.3% Interpretation: Current ratio decreased from 2019 to 2020. Liabilities-to-equity ratio increased from 2019 to 2020. Debt-to-equity ratio increased from 2019 to 2020. There are no major concerns regarding the company's liquidity. There are no major concerns regarding the company's solvency. There are no major concerns regarding the company's profitability. The quick ratio is a more conservative measure of liquidity than the current ratio. adidas AG Consolidated Statement of Financial Position (IFRS) in millions Note Dec. 31, 2020 Dec. 31, 2019 Assets Cash and cash equivalents Short-term financial assets Accounts receivable Other current financial assets Inventories Income tax receivables Other current assets Assets classified as held for sale Total current assets 05 06 07 08 09 36 10 3,994 2,220 0 292 1,952 2,625 702 544 4,397 4,085 109 94 999 1,076 0 12,154 10,934 11 12 13 14 14 Property, plant and equipment Right-of-use assets Goodwill Trademarks Other intangible assets Long-term financial assets Other non-current financial assets Deferred tax assets Other non-current assets Total non-current assets 2,157 2,430 1,208 750 252 353 414 1,233 103 2,380 2,931 1,257 859 305 367 450 1,093 103 9,746 15 16 36 17 8,899 Total assets 21,053 20,680 18 43 Liabilities and equity Short-term borrowings Accounts payable Current lease liabilities Other current financial liabilities Income taxes Other current provisions Current accrued liabilities Other current liabilities Total current liabilities 21 19 36 20 22 23 686 2,390 563 446 562 1,609 2,172 398 2,703 733 235 618 1,446 2,437 538 NIX 8,827 8,754 Long-term borrowings Non-current lease liabilities Other non-current financial liabilities Pensions and similar obligations Deferred tax liabilities Other non-current provisions Non-current accrued liabilities Other non-current liabilities Total non-current liabilities 18 21 24 25 36 20 22 26 2,482 2,159 115 284 241 229 1,595 2,399 92 229 280 257 9 7 8 17 5,535 4,868 Share capital Reserves Retained earnings Shareholders' equity 195 (474) 6,733 196 45 6,555 6,796 27 6,454 Non-controlling interests 29 237 261 Total equity 6,691 7,058 Total liabilities and equity 21,053 20,680 adidas AG Consolidated Income Statement (IFRS) in millions Note 38 Year ending Dec. 31, 2020 19,844 9,990 9,855 49.7% 83 42 31 11, 14, 32, 33 Net sales Cost of sales Gross profit % of net sales) Royalty and commission income Other operating income Other operating expenses % of net sales) Marketing and point-of-sale expenses (% of net sales) Distribution and selling expenses % of net sales) General and administration expenses (% of net sales) Sundry expenses % of net sales) Impairment losses (net) on accounts receivable and contract assets Operating profit % of net sales) Financial income Financial expenses Income before taxes 1% of net sales) Income taxes % of income before taxes) Net income from continuing operations % of net sales) Gain from discontinued operations, net of tax Net income 9,229 46.5% 2,573 13.0% 4,962 25.0% 1,461 7.4% 119 0.6% Year ending Dec. 31, 2019 23,640 11,347 12,293 52.0% 154 56 9,843 41.6% 3,042 12.9% 4,997 21.1% 1,652 7.0% 134 0.6% 114 18 751 3.8% 29 204 34 34 575 2,660 11.3% 64 166 2,558 10.8% 640 25.0% 1,918 8.1% 59 1,977 2.9% 146 25.4% 429 2.2% 36 03 13 443 Note: For calculating return on equity, liabilities-to-equity ratio and debt-to-equity ratio, 'Total equity' from the balance sheet above must be used. Ratios: Ratio Return on equity Return on assets Net profit margin Asset turnover Current ratio Quick ratio Liabilities-to-equity ratio Debt-to-equity ratio 2020 6.69% 2.12% 2.23% 94.26% 1.38 0.67 214.6% 47.3% Interpretation: Current ratio decreased from 2019 to 2020. Liabilities-to-equity ratio increased from 2019 to 2020. Debt-to-equity ratio increased from 2019 to 2020. There are no major concerns regarding the company's liquidity. There are no major concerns regarding the company's solvency. There are no major concerns regarding the company's profitability. The quick ratio is a more conservative measure of liquidity than the current ratio


