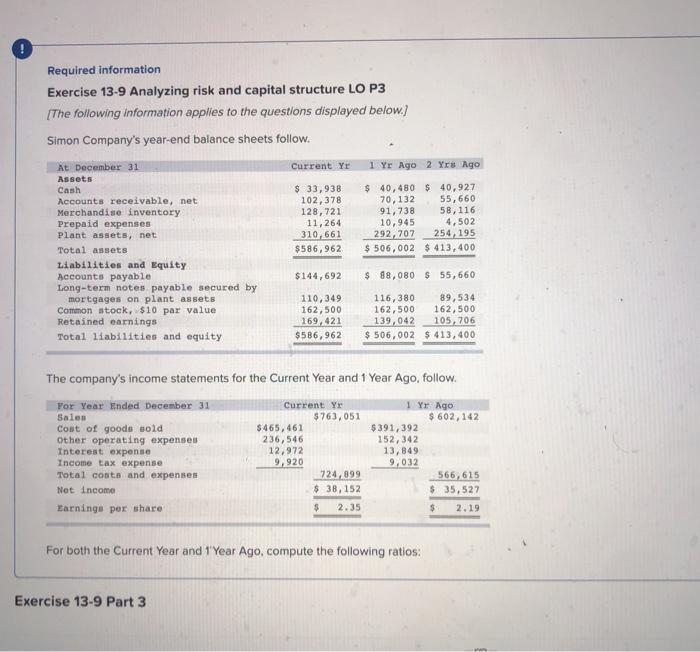
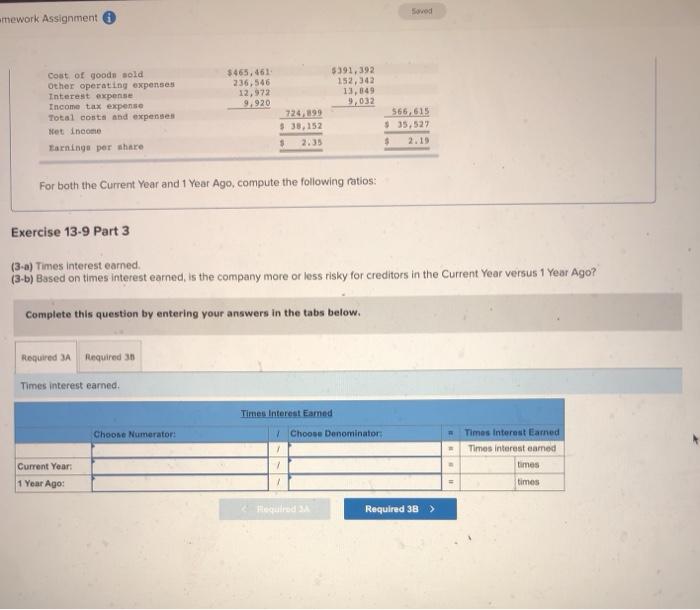
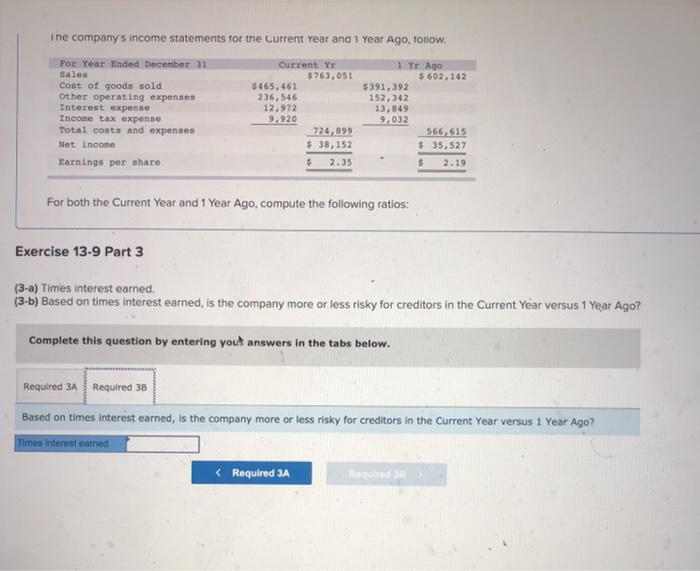
Required information Exercise 13-9 Analyzing risk and capital structure LO P3 [The following information applies to the questions displayed below.) Simon Company's year-end balance sheets follow. Current Yr 1 Yr Ago 2 Yrs Ago At December 31 Assets Cash Accounts receivable, net Merchandise inventory Prepaid expenses Plant assets, net Total assets Liabilities and Equity Accounts payable Long-term notes payable secured by mortgages on plant assets Common stock, $10 par value Retained earnings Total liabilities and equity $ 33,938 102,378 128,721 11,264 310, 661 $586,962 $ 40,480 $ 40,927 70, 132 55,660 91,738 58,116 10,945 4,502 292,707 254, 195 $ 506,002 $ 413,400 $144,692 $ 88,080 $ 55,660 110,349 162,500 169,421 $586,962 116, 380 89,534 162,500 162,500 139,042 105, 706 $ 506,002 $ 413,400 The company's income statements for the Current Year and 1 Year Ago follow. For Year Ended December 31 Sales Cost of goods sold Other operating expenses Interest expense Income tax expense Total costs and expenses Net Income Earninge per share Current Yr $763,051 $465,461 236,546 12,972 9,920 724,899 $ 38,152 1 Yr Ago $ 602, 142 $391,392 152,342 13,849 9,032 566,615 $ 35,527 $ 2.19 $ 2.35 For both the Current Year and 1 Year Ago, compute the following ratios: Exercise 13-9 Part 3 Soved mework Assignment $465, 461 236,546 12,972 9.920 5391,392 152,342 13,849 9,032 Cost of goods sold Other operating expenses Interest expense Income tax expense Total costs and expenses Net Income Earnings per share 724,199 $ 38,152 $ 566,615 $ 35,527 For both the Current Year and 1 Year Ago, compute the following ratios: Exercise 13-9 Part 3 (3-a) Times interest earned, (3-b) Based on times interest earned, is the company more or less risky for creditors in the Current Year versus 1 Year Ago? Complete this question by entering your answers in the tabs below. Required A Required 36 Times interest earned Times Interest Eamed Choose Denominator Choose Numerator Times Interest Earned Times interest eamed times Current Year: 1 Year Ago: 1 1 = times Fegured Required 38 i ne company's income statements for the current Year and 1 Year Ago, Tollow. Por Year Ended December 31 Sales Cost of goods sold Other operating expenses Interest expense Income tax expense Total costs and expenses Net Income Earnings per share Current Ys $763, 051 5465,461 236,546 12,972 9.920 724,899 $ 38,152 $ 2.35 1 yr ago 5.602,142 $391,392 152,342 13,849 9.032 566,615 $ 35,527 $ 2.19 For both the Current Year and 1 Year Ago, compute the following ratios: Exercise 13-9 Part 3 (3-a) Times interest earned. (3-b) Based on times interest earned, is the company more or less risky for creditors in the Current Year versus 1 Year Ago? Complete this question by entering yout answers in the tabs below. Required 3A Required 38 Based on times interest earned, is the company more or less risky for creditors in the Current Year versus 1 Year Ago? Times interesteamed