

Answered step by step
Verified Expert Solution
Question
1 Approved Answer
Required Information PR 7.41 (Static) CVP Graph; Cost Structure; Operating Leverage (LO 7.2, 7.3, 7.4, 7.8) [The following Information applies to the questions displayed below.]
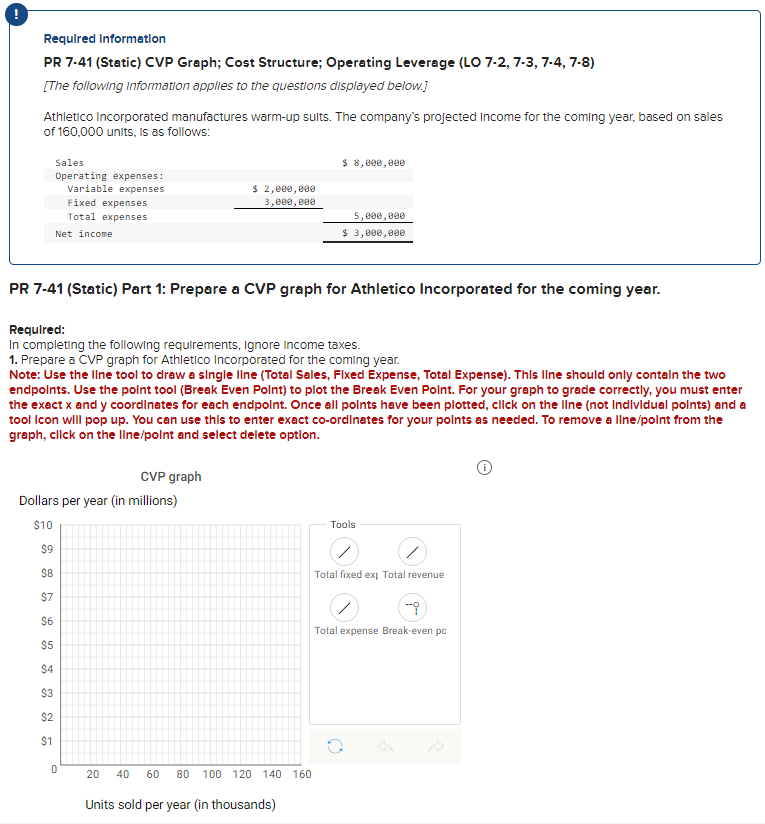 Required Information PR 7.41 (Static) CVP Graph; Cost Structure; Operating Leverage (LO 7.2, 7.3, 7.4, 7.8) [The following Information applies to the questions displayed below.] Athletico Incorporated manufactures warm-up sults. The company's projected Income for the coming year, based on sales of 160,000 units, is as follows: PR 7-41 (Static) Part 1: Prepare a CVP graph for Athletico Incorporated for the coming year. Requlred: In completing the following requirements, Ignore income taxes. 1. Prepare a CVP graph for Athletico Incorporated for the coming year. Note: Use the Ilne tool to draw a single Ilne (Total Sales, Flxed Expense, Total Expense). Thls Ilne should only contaln the two endpolnts. Use the polnt tool (Break Even Polnt) to plot the Break Even Polnt. For your graph to grade correctly, you must enter the exact x and y coordlnates for each endpolnt. Once all points have been plotted, cllck on the line (not Indlvidual polnts) and tool Icon will pop up. You can use thls to enter exact co-ordlnates for your polnts as needed. To remove a llne/point from the graph, cllck on the line/point and select delete option. Required Information PR 7.41 (Static) CVP Graph; Cost Structure; Operating Leverage (LO 7.2, 7.3, 7.4, 7.8) [The following Information applies to the questions displayed below.] Athletico Incorporated manufactures warm-up sults. The company's projected Income for the coming year, based on sales of 160,000 units, is as follows: PR 7-41 (Static) Part 1: Prepare a CVP graph for Athletico Incorporated for the coming year. Requlred: In completing the following requirements, Ignore income taxes. 1. Prepare a CVP graph for Athletico Incorporated for the coming year. Note: Use the Ilne tool to draw a single Ilne (Total Sales, Flxed Expense, Total Expense). Thls Ilne should only contaln the two endpolnts. Use the polnt tool (Break Even Polnt) to plot the Break Even Polnt. For your graph to grade correctly, you must enter the exact x and y coordlnates for each endpolnt. Once all points have been plotted, cllck on the line (not Indlvidual polnts) and tool Icon will pop up. You can use thls to enter exact co-ordlnates for your polnts as needed. To remove a llne/point from the graph, cllck on the line/point and select delete option
 Step by Step Solution
There are 3 Steps involved in it
Step: 1

Get Instant Access to Expert-Tailored Solutions
See step-by-step solutions with expert insights and AI powered tools for academic success
Step: 2

Step: 3
Ace Your Homework with AI
Get the answers you need in no time with our AI-driven, step-by-step assistance
Get Started
Managerial Accounting
Authors: Ray H. Garrison, Eric W. Noreen, Peter C. Brewer
13th Edition
978-0073379616, 73379611, 978-0697789938