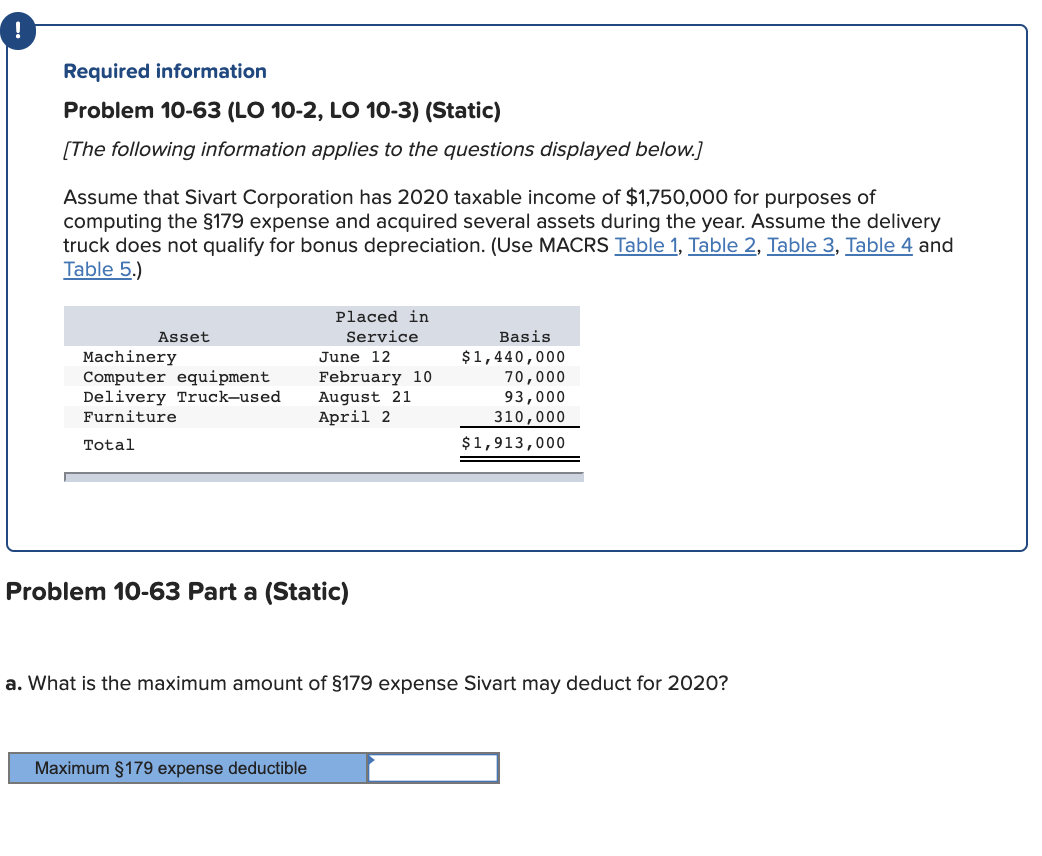
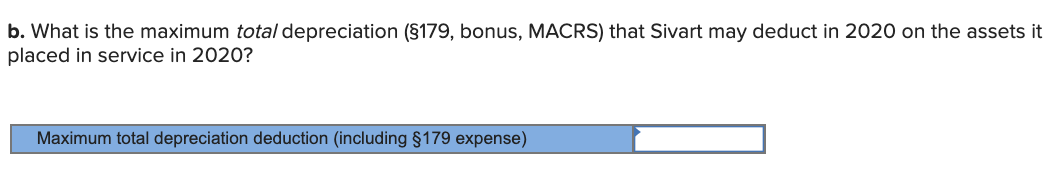
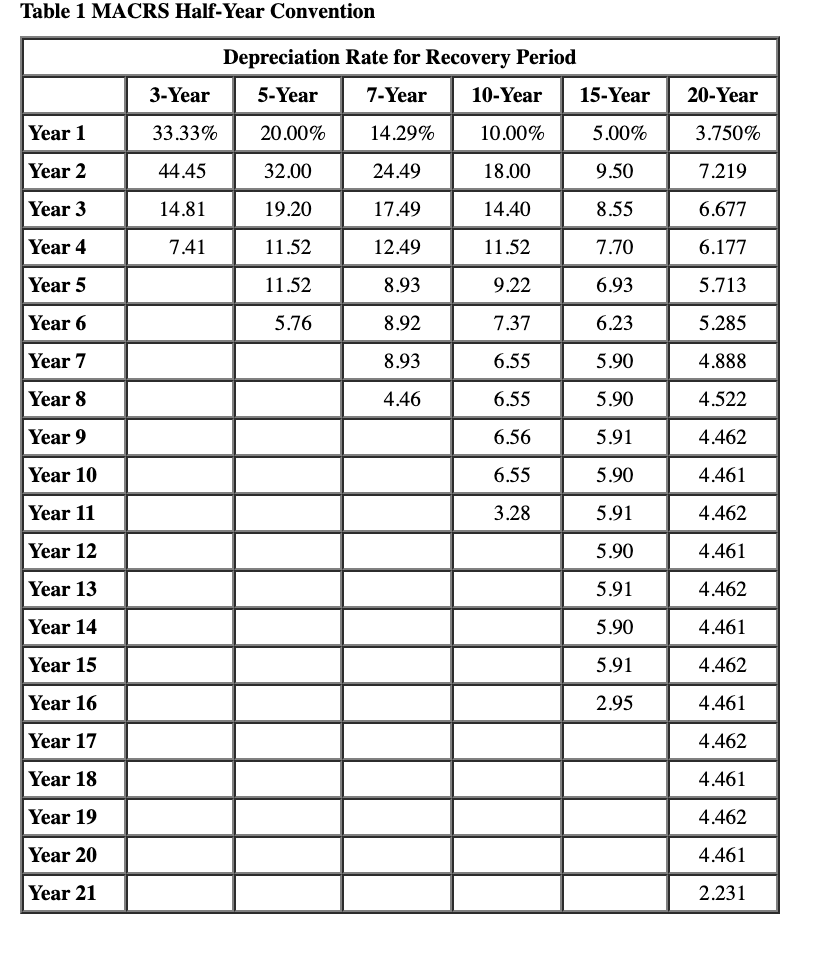
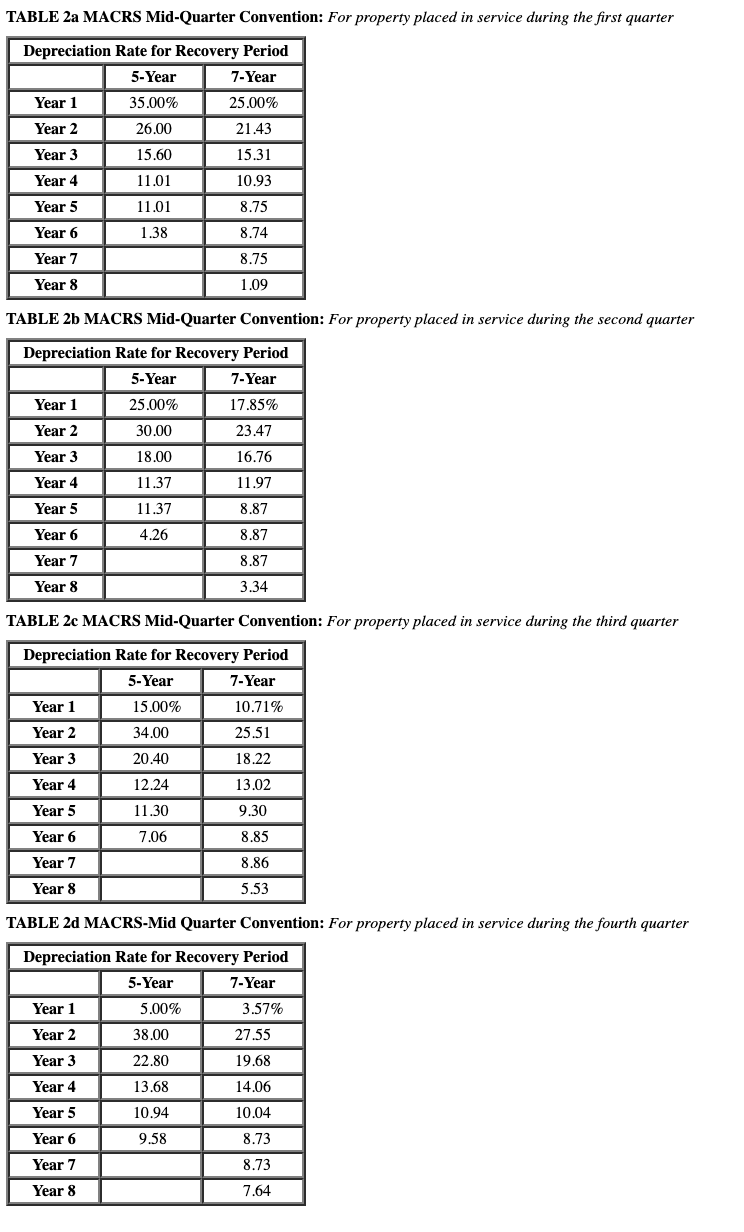
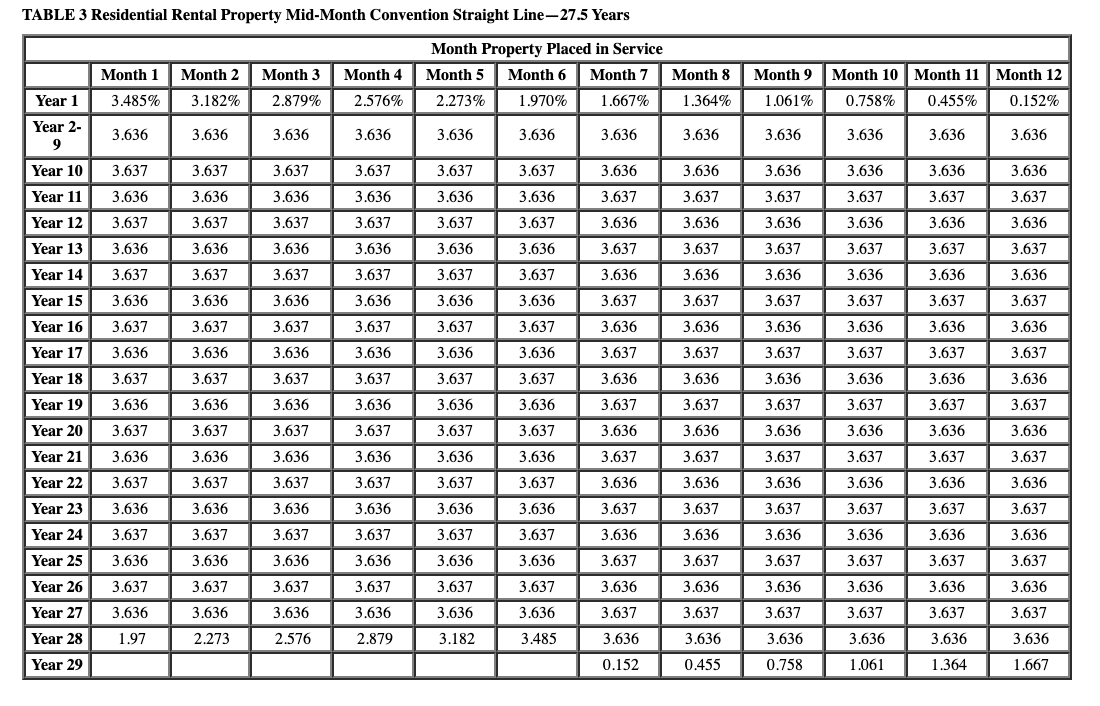
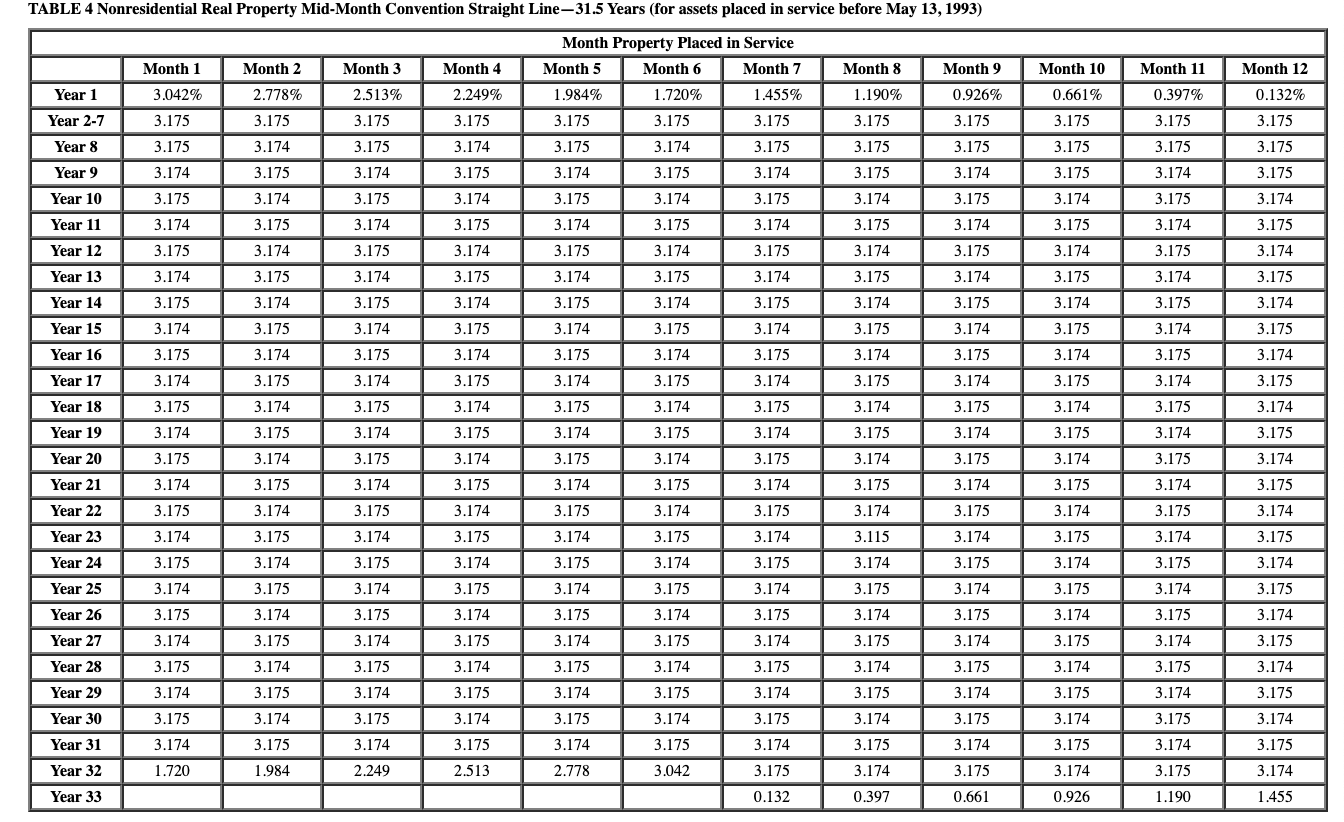
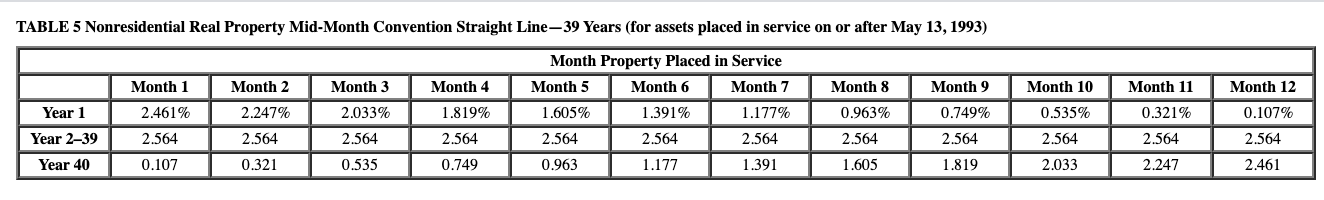
Required information Problem 10-63 (LO 10-2, LO 10-3) (Static) [The following information applies to the questions displayed below.) Assume that Sivart Corporation has 2020 taxable income of $1,750,000 for purposes of computing the $179 expense and acquired several assets during the year. Assume the delivery truck does not qualify for bonus depreciation. (Use MACRS Table 1, Table 2, Table 3, Table 4 and Table 5.) Asset Machinery Computer equipment Delivery Truck-used Furniture Placed in Service June 12 February 10 August 21 April 2 Basis $1,440,000 70,000 93,000 310,000 $1,913,000 Total Problem 10-63 Part a (Static) a. What is the maximum amount of $179 expense Sivart may deduct for 2020? Maximum $179 expense deductible b. What is the maximum total depreciation ($179, bonus, MACRS) that Sivart may deduct in 2020 on the assets it placed in service in 2020? Maximum total depreciation deduction (including $179 expense) Table 1 MACRS Half-Year Convention Depreciation Rate for Recovery Period 3-Year 5-Year 7-Year 10-Year 15-Year 20-Year Year 1 33.33% 20.00% 14.29% 10.00% 5.00% 3.750% Year 2 44.45 32.00 24.49 18.00 9.50 7.219 Year 3 14.81 19.20 17.49 14.40 8.55 6.677 Year 4 7.41 11.52 12.49 11.52 7.70 6.177 Year 5 11.52 8.93 9.22 6.93 5.713 Year 6 5.76 8.92 7.37 6.23 5.285 Year 7 8.93 6.55 5.90 4.888 Year 8 4.46 6.55 5.90 4.522 Year 9 6.56 5.91 4.462 Year 10 6.55 5.90 4.461 Year 11 3.28 5.91 4.462 Year 12 5.90 4.461 Year 13 5.91 4.462 Year 14 5.90 4.461 Year 15 5.91 4.462 Year 16 2.95 4.461 Year 17 4.462 Year 18 4.461 Year 19 4.462 Year 20 4.461 Year 21 2.231 TABLE 2a MACRS Mid-Quarter Convention: For property placed in service during the first quarter Depreciation Rate for Recovery Period 5-Year 7-Year Year 1 35.00% 25.00% Year 2 26.00 21.43 Year 3 15.60 15.31 Year 4 11.01 10.93 Year 5 11.01 8.75 Year 6 1.38 8.74 Year 7 8.75 Year 8 1.09 TABLE 26 MACRS Mid-Quarter Convention: For property placed in service during the second quarter Depreciation Rate for Recovery Period 5-Year 7-Year Year 1 25.00% 17.85% Year 2 30.00 23.47 Year 3 18.00 16.76 Year 4 11.37 11.97 Year 5 11.37 Year 6 4.26 8.87 8.87 Year 7 8.87 Year 8 3.34 TABLE C MACRS Mid-Quarter Convention: For property placed in service during the third quarter Depreciation Rate for Recovery Period 5-Year 7-Year Year 1 15.00% 10.71% Year 2 34.00 25.51 Year 3 20.40 18.22 Year 4 12.24 13.02 Year 5 11.30 9.30 Year 6 7.06 Year 7 8.86 Year 8 5.53 8.85 TABLE 20 MACRS-Mid Quarter Convention: For property placed in service during the fourth quarter Depreciation Rate for Recovery Period 5-Year 7-Year Year 1 5.00% 3.57% Year 2 38.00 27.55 Year 3 22.80 19.68 13.68 14.06 Year 4 Year 5 10.94 10.04 Year 6 9.58 8.73 8.73 Year 7 Year 8 7.64 TABLE 3 Residential Rental Property Mid-Month Convention Straight Line-27.5 Years Month Property Placed in Service Month 1 Month 2 Month 3 Month 4 Month 5 Month 6 Month 7 Month 8 Year 1 3.485% 3.182% 2.879% 2.576% 2.273% 1.970% 1.667% 1.364% Year 2- 3.636 3.636 3.636 3.636 3.636 3.636 3.636 3.636 9 Month 10 Month 11 Month 12 Month 9 1,061% 0.758% 0.455% 0.152% 3.636 3.636 3.636 3.636 Year 10 3.637 3.637 3.637 3.637 3.637 3.637 3.636 3.636 3.636 3.636 3.636 3.636 3.636 3.636 3.636 3.636 3.636 3.636 3.637 3.637 3.637 3.637 3.637 3.637 Year 11 Year 12 Year 13 3.637 3.637 3.637 3.637 3.637 3.637 3.636 3.636 3.636 3.636 3.636 3.636 3.636 3.636 3.636 3.636 3.636 3.636 3.637 3.637 3.637 3.637 3.637 3.637 Year 14 3.637 3.637 3.637 3.637 3.637 3.637 3.636 3.636 3.636 3.636 3.636 3.636 Year 15 3.636 3.636 3.636 3.636 3.636 3.636 3.637 3.637 3.637 3.637 3.637 3.637 Year 16 3.637 3.637 3.637 3.637 3.637 3.637 3.636 3.636 3.636 3.636 3.636 3.636 3.637 3.636 3.636 3.636 3.636 3.636 3.636 3.637 3.637 3.637 3.637 Year 17 Year 18 3.637 3.636 3.637 3.637 3.637 3.637 3.637 3.637 3.636 3.636 3.636 3.636 3.636 Year 19 3.636 3.636 3.636 3.636 3.636 3.636 3.637 3.637 3.637 3.637 3.637 3.637 3.636 3.637 3.637 3.637 3.637 3.637 3.637 3.636 3.636 3.636 3.636 3.636 3.636 3.636 3.636 3.636 3.637 3.637 3.637 3.637 3.636 3.637 3.636 3.637 3.637 3.636 3.637 3.636 3.637 3.637 3.637 3.637 3.636 3.636 3.636 3.636 3.636 3.636 3.636 3.636 3.636 3.637 3.637 3.637 3.637 3.637 3.636 3.637 3.637 3.636 3.637 3.637 3.637 3.637 3.637 3.636 3.636 3.636 3.636 Year 20 Year 21 Year 22 Year 23 Year 24 Year 25 Year 26 Year 27 Year 28 Year 29 3.636 3.637 3.636 3.636 3.636 3.636 3.636 3.636 3.637 3.637 3.637 3.637 3.637 3.637 3.637 3.637 3.637 3.637 3.637 3.636 3.636 3.636 3.636 3.636 3.636 3.636 3.636 3.636 3.636 3.636 3.637 3.637 3.637 3.637 3.637 3.637 3.636 1.97 2.273 2.576 2.879 3.182 3.485 3.636 3.636 3.636 3.636 3.636 3.636 0.152 0.455 0.758 1.061 1.364 1.667 Month 10 Month 11 Month 12 0.132% 0.397% 0.661% 3.175 3.175 3.175 3.175 3.175 3.175 3.175 3.174 3.175 3.174 3.175 3.174 3.174 3.175 3.175 3.174 3.175 3.174 3.175 3.174 3.175 3.174 3.175 3.174 3.174 3.175 3.175 3.174 3.175 3.174 3.175 3.174 3.175 TABLE 4 Nonresidential Real Property Mid-Month Convention Straight Line-31.5 Years (for assets placed in service before May 13, 1993) Month Property Placed in Service Month 1 Month 2 Month 3 Month 4 Month 5 Month 6 Month 7 Month 8 Month 9 Year 1 3.042% 2.778% 2.513% 2.249% 1.984% 1.720% 1.455% 1.190% 0.926% Year 2-7 3.175 3.175 3.175 3.175 3.175 3.175 3.175 3.175 3.175 Year 8 3.175 3.174 3.175 3.174 3.175 3.174 3.175 3.175 3.175 Year 9 3.174 3.175 3.174 3.175 3.174 3.175 3.174 3.175 3.174 Year 10 3.175 3.174 3.175 3.174 3.175 3.174 3.175 3.174 3.175 Year 11 3.174 3.175 3.174 3.175 3.174 3.175 3.174 3.175 3.174 Year 12 3.175 3.174 3.175 3.174 3.175 3.174 3.175 3.174 3.175 Year 13 3.174 3.175 3.174 3.175 3.174 3.175 3.174 3.175 3.174 Year 14 3.175 3.174 3.175 3.174 3.175 3.174 3.175 3.174 3.175 Year 15 3.174 3.175 3.174 3.175 3.174 3.175 3.174 3.175 3.174 Year 16 3.175 3.174 3.175 3.174 3.175 3.174 3.175 3.174 3.175 Year 17 3.174 3.175 3.174 3.175 3.174 3.175 3.174 3.175 3.174 Year 18 3.175 3.174 3.175 3.174 3.175 3.174 3.175 3.174 3.175 Year 19 3.174 3.175 3.174 3.175 3.174 3.175 3.174 3.175 3.174 Year 20 3.175 3.174 3.175 3.174 3.175 3.174 3.175 3.174 3.175 Year 21 3.174 3.175 3.174 3.175 3.174 3.175 3.174 3.175 3.174 Year 22 3.175 3.174 3.175 3.174 3.175 3.174 3.175 3.174 3.175 Year 23 3.174 3.175 3.174 3.175 3.174 3.175 3.174 3.115 3.174 Year 24 3.175 3.174 3.175 3.174 3.175 3.174 3.175 3.174 3.175 Year 25 3.174 3.175 3.174 3.175 3.174 3.175 3.174 3.175 3.174 Year 26 3.175 3.174 3.175 3.174 3.175 3.174 3.175 3.174 3.175 Year 27 3.174 3.175 3.174 3.175 3.174 3.175 3.174 3.175 3.174 Year 28 3.175 3.174 3.175 3.174 3.175 3.174 3.175 3.174 3.175 Year 29 3.174 3.175 3.174 3.175 3.174 3.175 3.174 3.175 3.174 Year 30 3.175 3.174 3.175 3.174 3.175 3.174 3.175 3.174 3.175 Year 31 3.174 3.175 3.174 3.175 3.174 3.175 3.174 3.175 3.174 Year 32 1.720 1.984 2.249 2.513 2.778 3.042 3.175 3.174 3.175 Year 33 0.132 0.397 0.661 3.174 3.175 3.174 3.175 3.174 3.174 3.175 3.175 3.174 3.174 3.175 3.174 3.175 3.174 3.175 3.175 3.174 3.175 3.174 3.175 3.174 3.174 3.175 3.175 3.174 3.175 3.174 3.175 3.174 3.175 3.174 3.175 3.174 3.175 3.174 3.175 3.174 3.175 3.174 3.175 3.174 3.175 3.174 3.175 3.174 0.926 1.190 1.455 TABLE 5 Nonresidential Real Property Mid-Month Convention Straight Line-39 Years (for assets placed in service on or after May 13, 1993) Month 2 Month 3 Month 8 Month 9 Month 11 Month 12 Month 1 2.461% 2.564 Month 4 1.819% 2.247% 2.033% 0.963% Month Property Placed in Service Month 5 Month 6 Month 7 1.605% 1.391% 1.177% 2.564 2.564 2.564 0.963 1.177 1.391 Year 1 Year 2-39 0.749% 0.107% Month 10 0.535% 2.564 2.033 0.321% 2.564 2.564 2.564 2.564 2.564 2.564 2.564 Year 40 0.107 0.321 0.535 0.749 1.605 1.819 2.247 2.461