Answered step by step
Verified Expert Solution
Link Copied!

Question

1 Approved Answer

Required information Problem 13-2A Ratios, common-size statements, and trend percents LO P1, P2, P3 [The following information applies to the questions displayed below.) Selected comparative
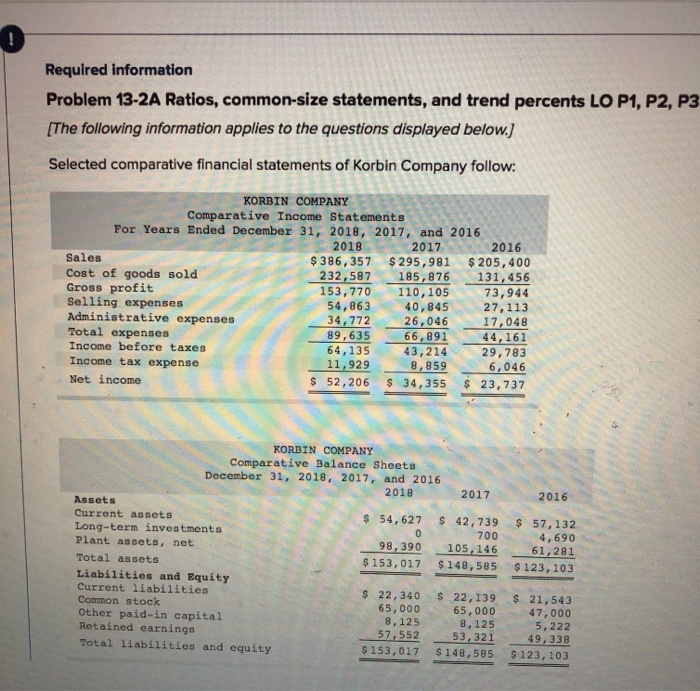
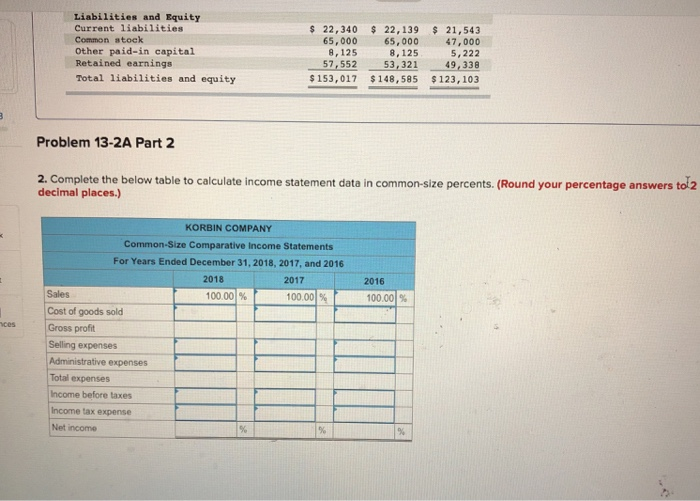
image text in transcribed
Required information Problem 13-2A Ratios, common-size statements, and trend percents LO P1, P2, P3 [The following information applies to the questions displayed below.) Selected comparative financial statements of Korbin Company follow: KORBIN COMPANY Comparative Income Statements For Years Ended December 31, 2018, 2017, and 2016 2018 2017 2016 Sales $ 386, 357 $295,981 $ 205,400 Cost of goods sold 232,587 185,876 131,456 Gross profit 153,770 110,105 73,944 Selling expenses 54,863 40,845 27,113 Administrative expenses 34,772 26,046 17,048 Total expenses 89,635 66,891 44,161 Income before taxes 64, 135 43,21429, 783 Income tax expense 11,929 8,859 6,046 Net income $ 52,206 $ 34, 355 $ 23, 737 89,435 43,214 2016 KORBIN COMPANY Comparative Balance Sheets December 31, 2018, 2017, and 2016 2018 2017 Assets Current assets $ 54,627 $ 42, 739 Long-term investments 700 Plant assets, net 98,390 105, 146 Total assets $ 153,017 $ 148,585 Liabilities and Equity Current liabilities $ 22, 340 $ 22,139 Common stock 65,000 65,000 Other paid-in capital 8,125 8,125 Retained earnings 57,552 53,321 Total liabilities and equity $ 153,017 $ 148,585 $ 57, 132 4,690 61,281 $ 123, 103 S 21,543 47,000 5,222 49,338 $ 123, 103 Liabilities and Equity Current liabilities Common stock Other paid-in capital Retained earnings Total liabilities and equity $ 22,340 65,000 8,125 57,552 $ 153,017 $ 22,139 65,000 8,125 53,321 $ 148,585 $ 21,543 47,000 5,222 49, 338 $123, 103 Problem 13-2A Part 2 2. Complete the below table to calculate income statement data in common-size percents. (Round your percentage answers tol2 decimal places.) 2016 KORBIN COMPANY Common-Size Comparative Income Statements For Years Ended December 31, 2018, 2017, and 2016 2018 2017 Sales 100.00 % 100,00 % Cost of goods sold Gross profit Selling expenses Administrative expenses Total expenses ces Income before taxes Income tax expense Net income

Step by Step Solution

There are 3 Steps involved in it

Step: 1

blur-text-image

Get Instant Access to Expert-Tailored Solutions

See step-by-step solutions with expert insights and AI powered tools for academic success

Step: 2

blur-text-image_2

Step: 3

blur-text-image_3

Ace Your Homework with AI

Get the answers you need in no time with our AI-driven, step-by-step assistance

Get Started

Recommended Textbook for

Mastering Cloud Auditing A Comprehensive Guide To Learn Cloud Auditing

Authors: Cybellium Ltd, Kris Hermans

1st Edition

B0CHL8DYC7, 979-8861283809

More Books

Students also viewed these Accounting questions

Question

4. Are there any disadvantages?

Answered: 1 week ago

Question

3. What are the main benefits of using more information technology?

Answered: 1 week ago

Question

start to review and develop your employability skills

Answered: 1 week ago