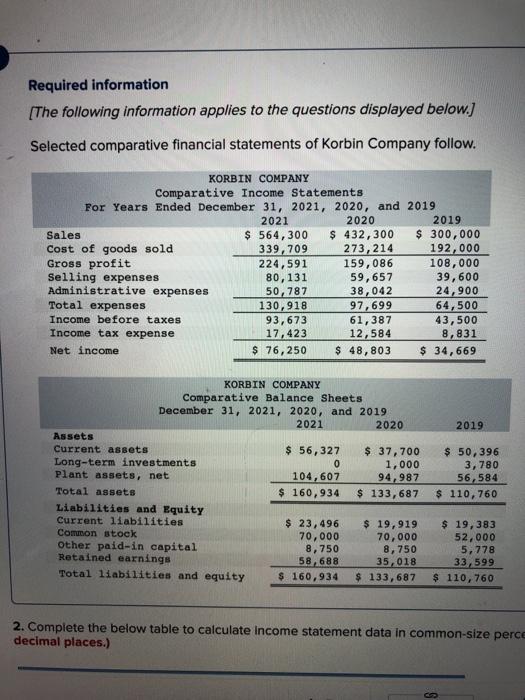
Required information [The following information applies to the questions displayed below.) Selected comparative financial statements of Korbin Company follow. KORBIN COMPANY Comparative Income Statements For Years Ended December 31, 2021, 2020, and 2019 2021 2020 2019 Sales $ 564,300 $ 432,300 $ 300,000 Cost of goods sold 339,709 273, 214 192,000 Gross profit 224,591 159,086 108,000 Selling expenses 80,131 59,657 39,600 Administrative expenses 50,787 38,042 24,900 Total expenses 130,918 97,699 64,500 Income before taxes 93,673 61,387 43,500 Income tax expense 17,423 12,584 8,831 Net income $ 76,250 $ 48,803 $ 34,669 2019 KORBIN COMPANY Comparative Balance Sheets December 31, 2021, 2020, and 2019 2021 2020 Assets Current assets $ 56, 327 $ 37,700 Long-term investments 0 1,000 Plant assets, net 104,607 94,987 Total assets $ 160,934 $ 133,687 Liabilities and Equity Current liabilities $ 23,496 $ 19,919 Common stock 70,000 70,000 Other paid-in capital 8,750 8,750 Retained earnings 58.688 35,018 Total liabilities and equity $ 160,934 $ 133, 687 $ 50,396 3, 780 56,584 $ 110, 760 $ 19,383 52,000 5,778 33,599 $ 110, 760 2. Complete the below table to calculate income statement data in common-size perce decimal places.) 2021 2020 2019 $ 56,327 0 104,607 $ 160,934 $ 37, 700 1,000 94,987 $ 133,687 $ 50,39 3,78 56,58 $ 110,74 Assets Current assets Long-term investments Plant assets, net Total assets Liabilities and Equity Current liabilities Common stock Other paid-in capital Retained earnings Total liabilities and equity $ 23,496 70,000 8,750 58,688 $ 160,934 $ 19,919 70,000 8,750 35,018 $ 133,687 $ 19,3 52,00 5,77 33,59 $ 110,76 2. Complete the below table to calculate income statement data in common-size decimal places.) 2019 % KORBIN COMPANY Common-Size Comparative Income Statements For Years Ended December 31, 2021, 2020, and 2019 2021 2020 Sales % % Cost of goods sold Gross profit Selling expenses Administrative expenses Total expenses Income before taxes Income tax expense Net income % % % Saved 20 104,607 $ 160,934 94,987 $ 133,687 56,584 $ 110,760 Plant assets, net Total assets Liabilities and Equity Current liabilities Common stock Other paid-in capital Retained earnings Total liabilities and equity $ 23,496 70,000 8,750 58,688 $ 160,934 $ 19,919 70,000 8,750 35,018 $ 133,687 $ 19,383 52,000 5,778 33,599 $ 110,760 3. Complete the below table to calculate the balance sheet data in trend percents with 2019 as base answers to 2 decimal places.) KORBIN COMPANY Balance Sheet Data in Trend Percents December 31, 2021, 2020 and 2019 2021 2020 2019 Assets Current assets % 100.00 % Long-term investments 100.00 100.00 Plant assets, net Total assets Liabilities and Equity % 100.00 % Current liabilities % 100.00 % Common stock 100.00 Other paid-in capital 100.00 Retained earnings Total liabilities and equity 100.00 100,00 %