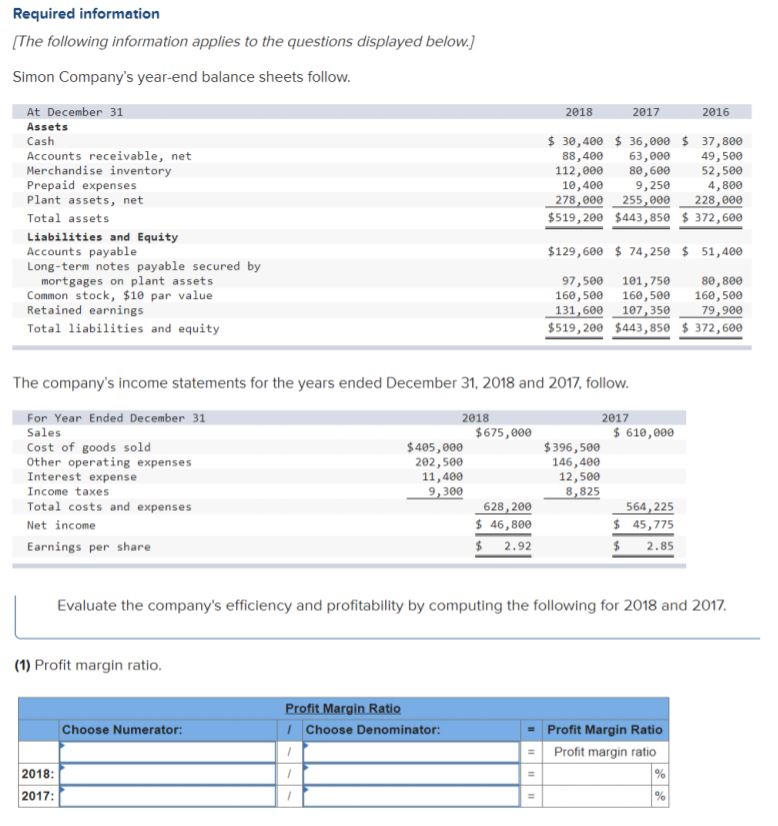
Required information (The following information applies to the questions displayed below.) Simon Company's year-end balance sheets follow. 2018 2017 2016 At December 31 Assets Cash Accounts receivable, net Merchandise inventory Prepaid expenses Plant assets, net Total assets Liabilities and Equity Accounts payable Long-term notes payable secured by mortgages on plant assets Common stock, $10 par value Retained earnings Total liabilities and equity $ 30,400 $ 36,000 $ 37,800 88,400 63,000 49,500 112,000 80, 600 52,500 10,400 9, 250 4,800 278,600 255,000 228,000 $519,200 $443,850 $ 372,600 $129,600 $ 74,250 $ 51,400 97,500 101,750 88,888 160,500 160,500 160,500 131,600 107,350 79,900 $519,200 $443,850 $ 372,600 The company's income statements for the years ended December 31, 2018 and 2017, follow. For Year Ended December 31 Sales Cost of goods sold Other operating expenses Interest expense Income taxes Total costs and expenses Net income Earnings per share 2018 $675,000 $405,000 202,500 11,400 9,300 628,200 $ 46,800 $ 2.92 2017 $ 610,000 $ 396,500 146,400 12,500 8,825 564, 225 $ 45,775 $ 2.85 Evaluate the company's efficiency and profitability by computing the following for 2018 and 2017. (1) Profit margin ratio. Profit Margin Ratio 1 Choose Denominator: Choose Numerator: Profit Margin Ratio = Profit margin ratio % % 2018: 2017: Required information (The following information applies to the questions displayed below.) Simon Company's year-end balance sheets follow. 2018 2017 2016 At December 31 Assets Cash Accounts receivable, net Merchandise inventory Prepaid expenses Plant assets, net Total assets Liabilities and Equity Accounts payable Long-term notes payable secured by mortgages on plant assets Common stock, $10 par value Retained earnings Total liabilities and equity $ 30,400 $ 36,000 $ 37,800 88,400 63,000 49,500 112,000 80, 600 52,500 10,400 9, 250 4,800 278,600 255,000 228,000 $519,200 $443,850 $ 372,600 $129,600 $ 74,250 $ 51,400 97,500 101,750 88,888 160,500 160,500 160,500 131,600 107,350 79,900 $519,200 $443,850 $ 372,600 The company's income statements for the years ended December 31, 2018 and 2017, follow. For Year Ended December 31 Sales Cost of goods sold Other operating expenses Interest expense Income taxes Total costs and expenses Net income Earnings per share 2018 $675,000 $405,000 202,500 11,400 9,300 628,200 $ 46,800 $ 2.92 2017 $ 610,000 $ 396,500 146,400 12,500 8,825 564, 225 $ 45,775 $ 2.85 Evaluate the company's efficiency and profitability by computing the following for 2018 and 2017. (1) Profit margin ratio. Profit Margin Ratio 1 Choose Denominator: Choose Numerator: Profit Margin Ratio = Profit margin ratio % % 2018: 2017