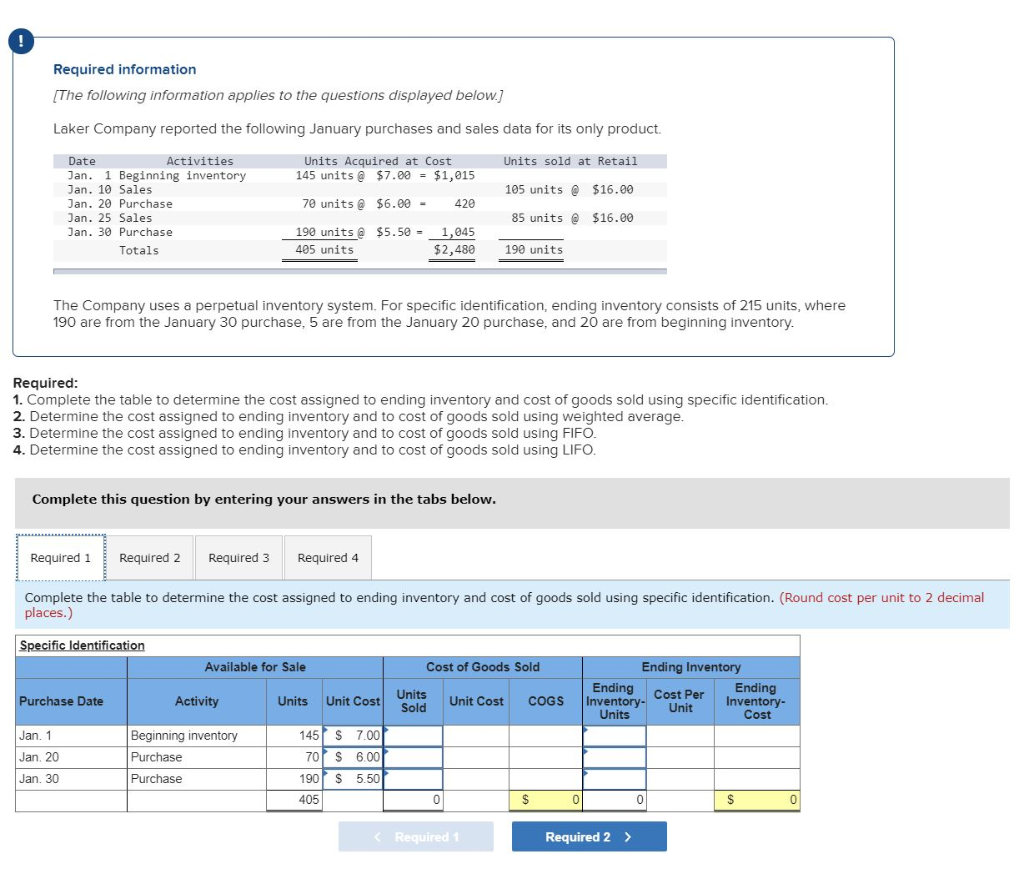
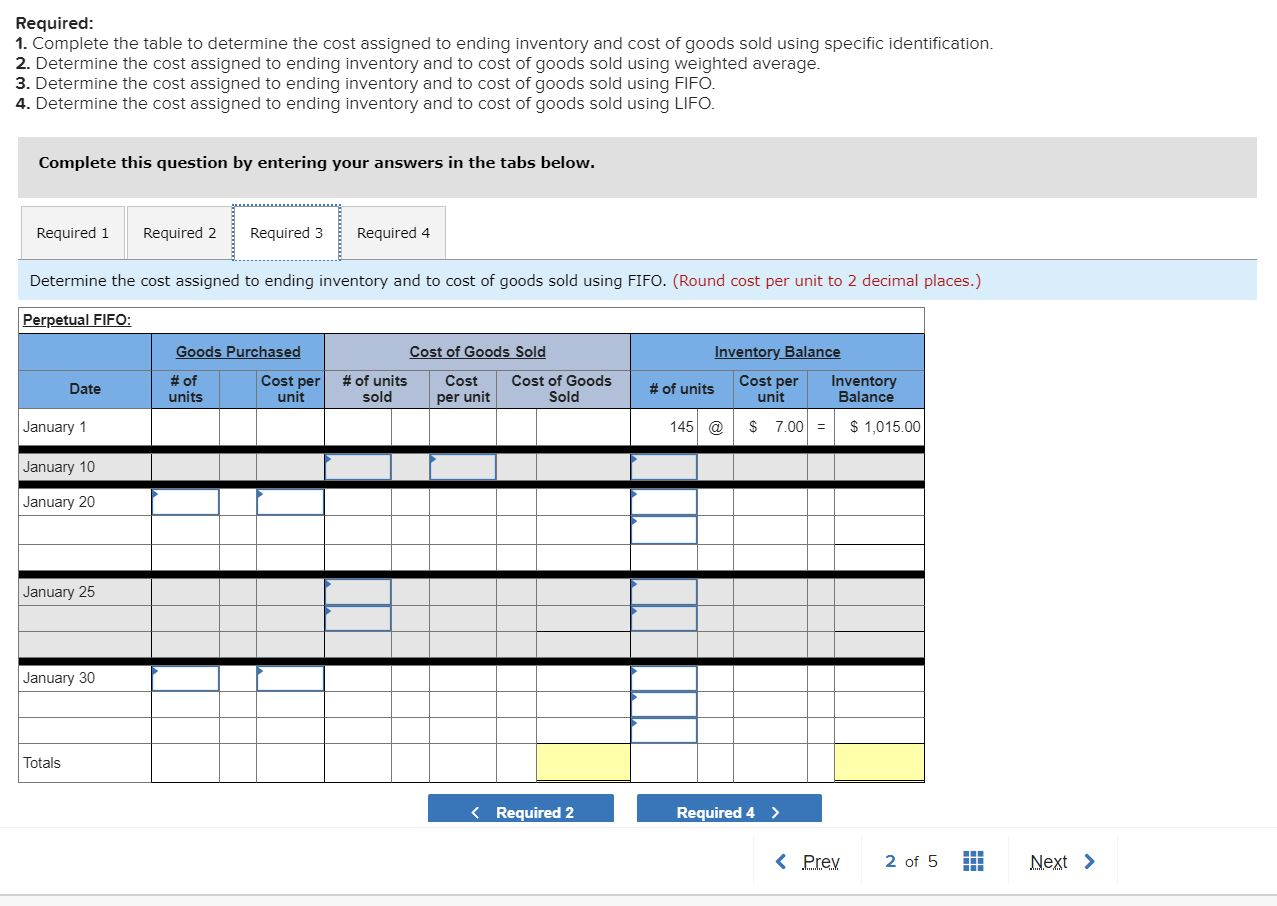
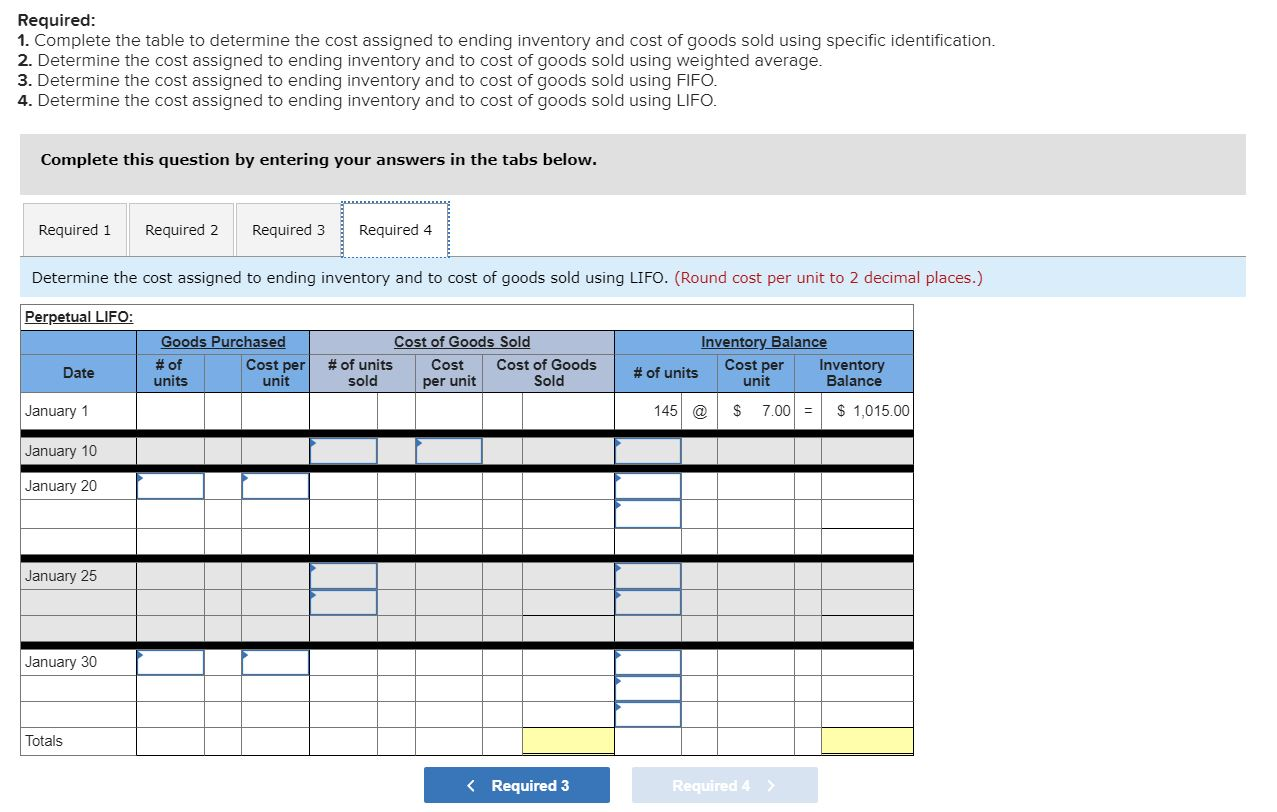
Required information [The following information applies to the questions displayed below.] Laker Company reported the following January purchases and sales data for its only product. Units sold at Retail Units Acquired at Cost 145 units @ $7.00 = $1,015 Date Activities Jan. 1 Beginning inventory Jan. 10 Sales Jan. 20 Purchase Jan. 25 Sales Jan. 30 Purchase 105 units @ $16.00 70 units @ $6.00 - 420 85 units @ $16.00 Totals 190 units @ $5.58 - 1,045 405 units $2,480 190 units The Company uses a perpetual inventory system. For specific identification, ending inventory consists of 215 units, where 190 are from the January 30 purchase, 5 are from the January 20 purchase, and 20 are from beginning inventory. Required: 1. Complete the table to determine the cost assigned to ending inventory and cost of goods sold using specific identification. 2. Determine the cost assigned to ending inventory and to cost of goods sold using weighted average. 3. Determine the cost assigned to ending inventory and to cost of goods sold using FIFO. 4. Determine the cost assigned to ending inventory and to cost of goods sold using LIFO. Complete this question by entering your answers in the tabs below. Required 1 Required 2 Required 3 Required 4 Complete the table to determine the cost assigned to ending inventory and cost of goods sold using specific identification. (Round cost per unit to 2 decimal places.) Specific Identification Available for Sale Cost of Goods Sold Ending Inventory Ending Cost Per Ending Inventory- Inventory- Units Cost Purchase Date Activity Units Units Sold Unit Cost Unit Cost COGS Unit Jan. 1 Jan 20 Jan. 30 Beginning inventory Purchase Purchase 145 $ 7.00 70 $ 6.00 190 $ 5.50 405 0 $ 0 S 0 Required: 1. Complete the table to determine the cost assigned to ending inventory and cost of goods sold using specific identification. 2. Determine the cost assigned to ending inventory and to cost of goods sold using weighted average. 3. Determine the cost assigned to ending inventory and to cost of goods sold using FIFO. 4. Determine the cost assigned to ending inventory and to cost of goods sold using LIFO. Complete this question by entering your answers in the tabs below. Required 1 Required 2 Required 3 Required 4 Determine the cost assigned to ending inventory and to cost of goods sold using FIFO. (Round cost per unit to 2 decimal places.) Perpetual FIFO: Goods Purchased Cost of Goods Sold Inventory Balance Cost per Date # of units # of units sold Cost per unit Cost of Goods Sold # of units Cost per unit Inventory Balance unit January 1 145 @ $ 7.00 = $ 1,015.00 January 10 January 20 January 25 January 30 Totals Required 2 Required 4 > Required: 1. Complete the table to determine the cost assigned to ending inventory and cost of goods sold using specific identification. 2. Determine the cost assigned to ending inventory and to cost of goods sold using weighted average. 3. Determine the cost assigned to ending inventory and to cost of goods sold using FIFO. 4. Determine the cost assigned to ending inventory and to cost of goods sold using LIFO. Complete this question by entering your answers in the tabs below. Required 1 Required 2 Required 3 Required 4 Determine the cost assigned to ending inventory and to cost of goods sold using LIFO. (Round cost per unit to 2 decimal places.) Perpetual LIFO: Goods Purchased # of units unit Cost per Cost of Goods Sold # of units Cost Cost of Goods sold per unit Sold Inventory Balance Cost per Inventory # of units unit Balance Date January 1 145 @ $ 7.00 = $ 1,015.00 January 10 January 20 January 25 January 30 Totals