

Answered step by step
Verified Expert Solution
Question
1 Approved Answer
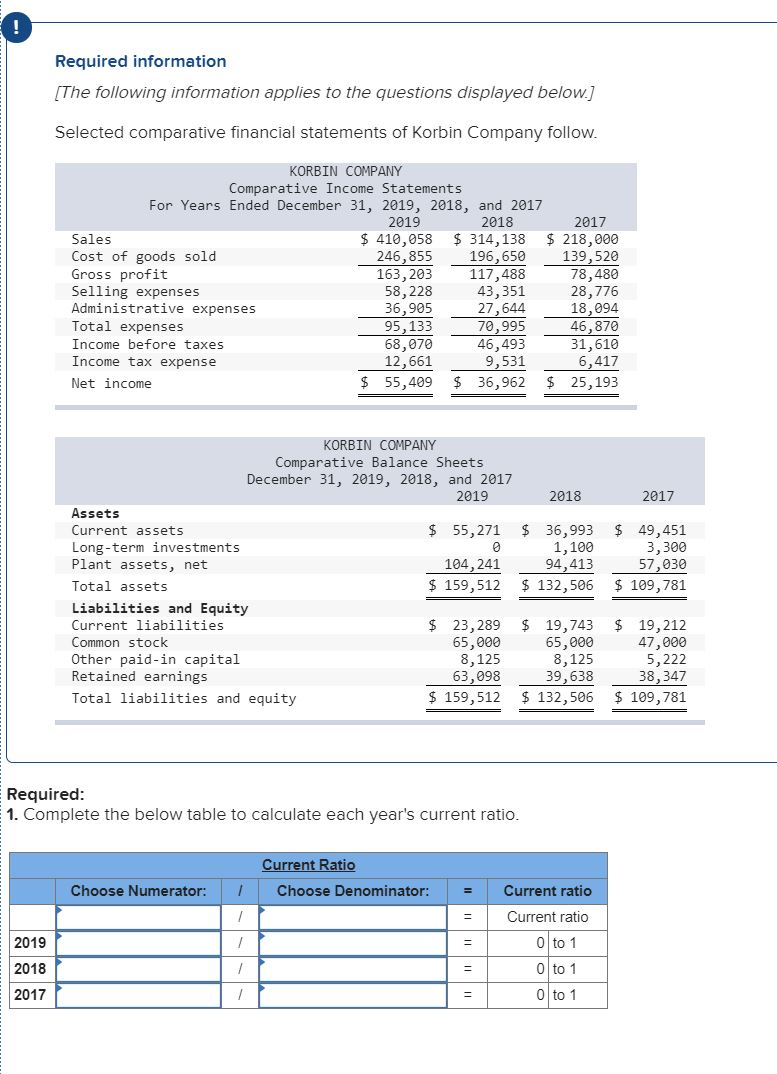
Required information [The following information applies to the questions displayed below.] Selected comparative financial statements of Korbin Company follow. KORBIN COMPANY Comparative Income Statements For
Step by Step Solution
There are 3 Steps involved in it
Step: 1

Get Instant Access to Expert-Tailored Solutions
See step-by-step solutions with expert insights and AI powered tools for academic success
Step: 2

Step: 3
Ace Your Homework with AI
Get the answers you need in no time with our AI-driven, step-by-step assistance
Get Started
Development Of Audit Findings Of A National Survey Of Healthcare Provider Units In England Evaluating Medical Audit
Authors: Yvette, Buttery
1st Edition
1898845018, 978-1898845010