

Answered step by step
Verified Expert Solution
Question
1 Approved Answer
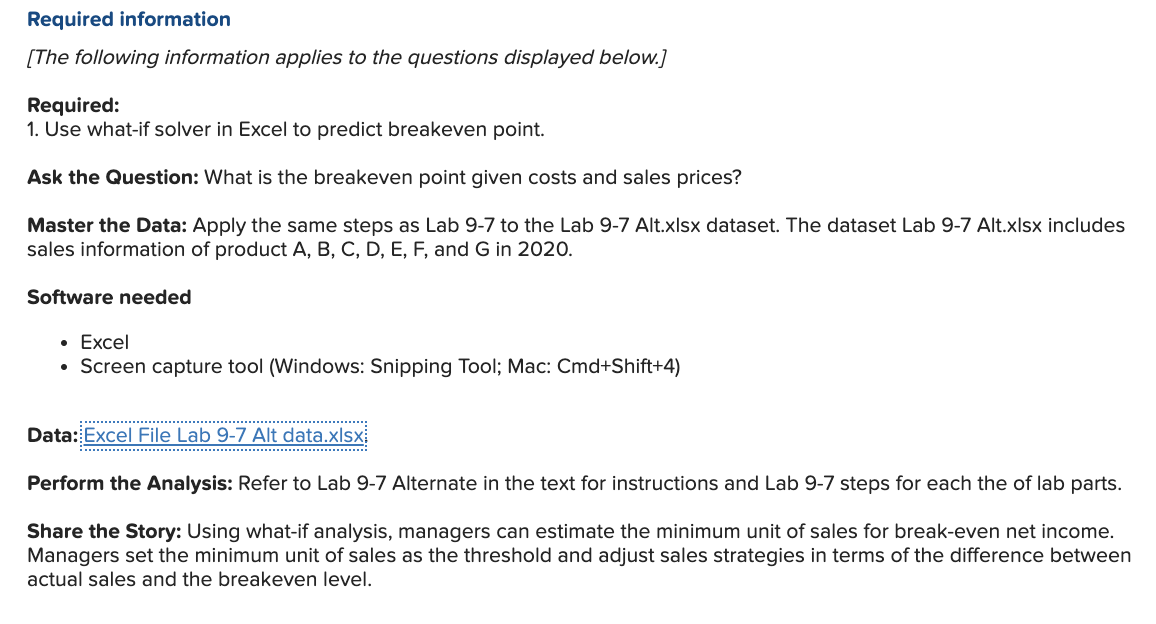
Required information [The following information applies to the questions displayed below.] Required: 1. Use what-if solver in Excel to predict breakeven point. Ask the Question:
Step by Step Solution
There are 3 Steps involved in it
Step: 1

Get Instant Access to Expert-Tailored Solutions
See step-by-step solutions with expert insights and AI powered tools for academic success
Step: 2

Step: 3
Ace Your Homework with AI
Get the answers you need in no time with our AI-driven, step-by-step assistance
Get Started
Managerial Accounting Tools For Business Decision Making Wileyplus Lms Student Package
Authors: Jerry J. Weygandt, Paul D. Kimmel, Donald E. Kieso
8th Edition
1119390249, 978-1119390244