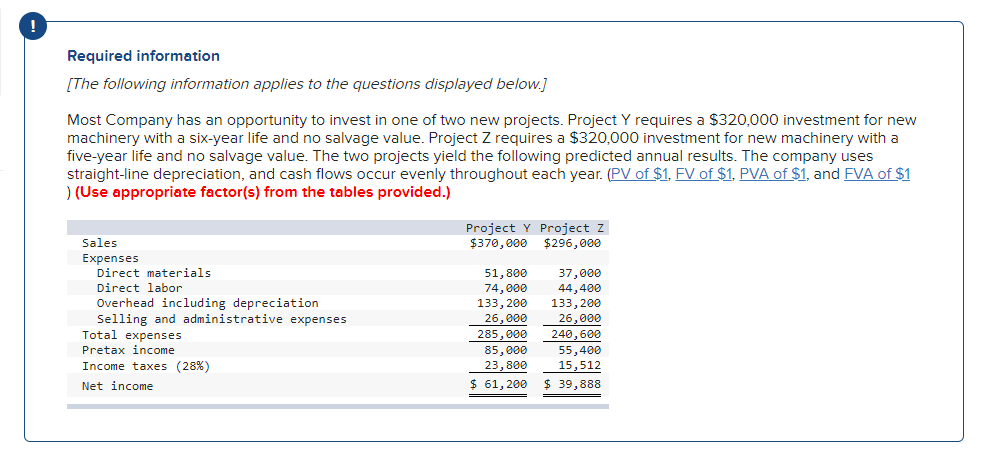
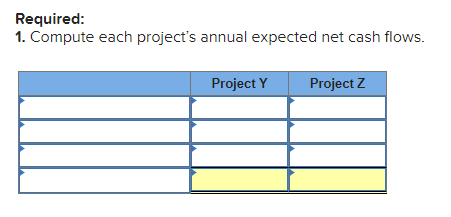
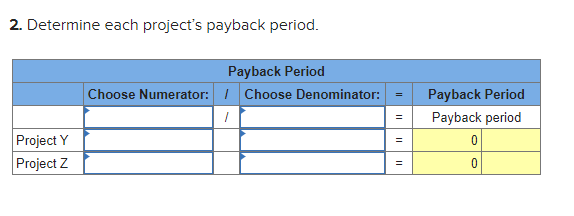
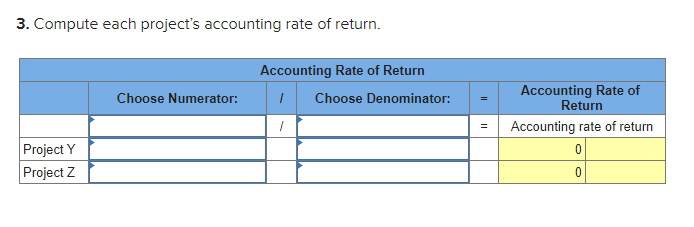
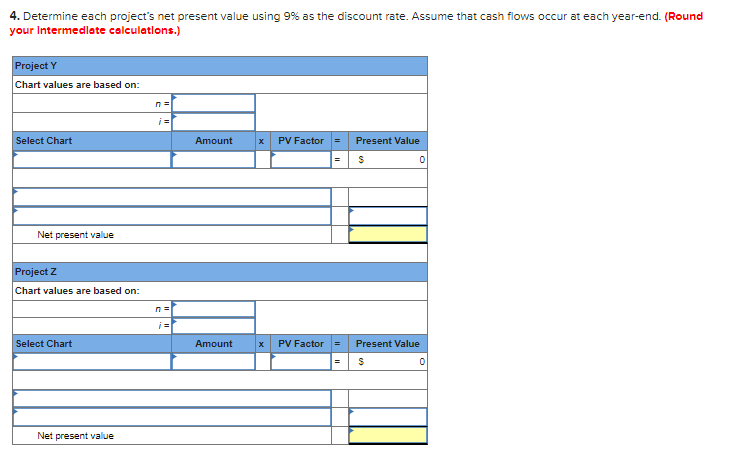
Required information (The following information applies to the questions displayed below.) Most Company has an opportunity to invest in one of two new projects. Project Y requires a $320,000 investment for new machinery with a six-year life and no salvage value. Project Z requires a $320,000 investment for new machinery with a five-year life and no salvage value. The two projects yield the following predicted annual results. The company uses straight-line depreciation, and cash flows occur evenly throughout each year. (PV of $1. FV of $1, PVA of $1, and FVA of $1 ) (Use appropriate factor(s) from the tables provided.) Project Y Project Z $370,000 $296,000 Sales Expenses Direct materials Direct labor Overhead including depreciation Selling and administrative expenses Total expenses Pretax income Income taxes (28%) Net income 51,800 74,000 133,200 26,000 285,000 85,000 23,800 $ 61,200 37,000 44,400 133,200 26,000 240,600 55,400 15,512 $ 39,888 Required: 1. Compute each project's annual expected net cash flows. Project Y Project Z 2. Determine each project's payback period. Payback Period Choose Numerator: 1 Choose Denominator: II Payback Period Payback period 0 0 11 Project Y Project Z 3. Compute each project's accounting rate of return. Accounting Rate of Return 1 Choose Denominator: Choose Numerator: = / Accounting Rate of Return Accounting rate of return 0 0 Project Y Project 2 4. Determine each project's net present value using 9% as the discount rate. Assume that cash flows occur at each year-end. (Round your Intermediate calculations.) Project Y Chart values are based on: Select Chart Amount X PV Factor - Present Value = S 0 Net present value Project z Chart values are based on: n = i = Select Chart Amount X PV Factor = Present Value S 0 Net present value Required information (The following information applies to the questions displayed below.) Most Company has an opportunity to invest in one of two new projects. Project Y requires a $320,000 investment for new machinery with a six-year life and no salvage value. Project Z requires a $320,000 investment for new machinery with a five-year life and no salvage value. The two projects yield the following predicted annual results. The company uses straight-line depreciation, and cash flows occur evenly throughout each year. (PV of $1. FV of $1, PVA of $1, and FVA of $1 ) (Use appropriate factor(s) from the tables provided.) Project Y Project Z $370,000 $296,000 Sales Expenses Direct materials Direct labor Overhead including depreciation Selling and administrative expenses Total expenses Pretax income Income taxes (28%) Net income 51,800 74,000 133,200 26,000 285,000 85,000 23,800 $ 61,200 37,000 44,400 133,200 26,000 240,600 55,400 15,512 $ 39,888 Required: 1. Compute each project's annual expected net cash flows. Project Y Project Z 2. Determine each project's payback period. Payback Period Choose Numerator: 1 Choose Denominator: II Payback Period Payback period 0 0 11 Project Y Project Z 3. Compute each project's accounting rate of return. Accounting Rate of Return 1 Choose Denominator: Choose Numerator: = / Accounting Rate of Return Accounting rate of return 0 0 Project Y Project 2 4. Determine each project's net present value using 9% as the discount rate. Assume that cash flows occur at each year-end. (Round your Intermediate calculations.) Project Y Chart values are based on: Select Chart Amount X PV Factor - Present Value = S 0 Net present value Project z Chart values are based on: n = i = Select Chart Amount X PV Factor = Present Value S 0 Net present value