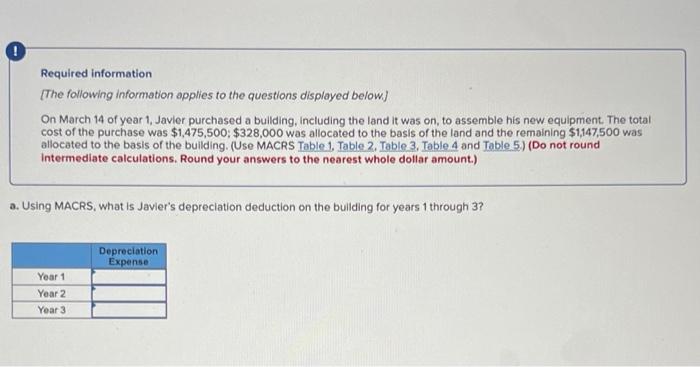
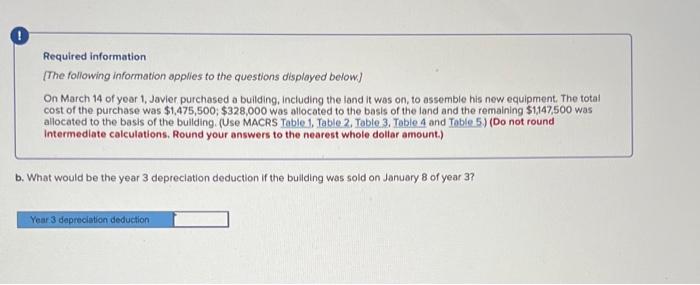
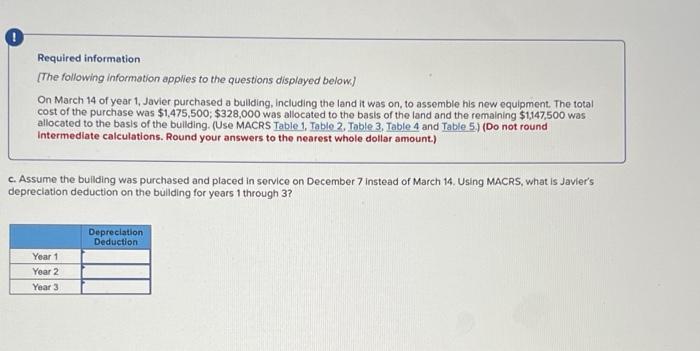
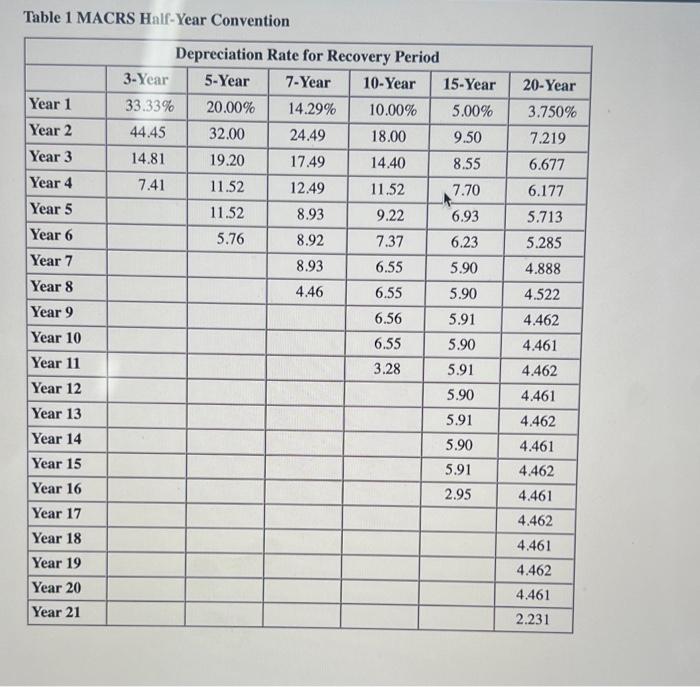
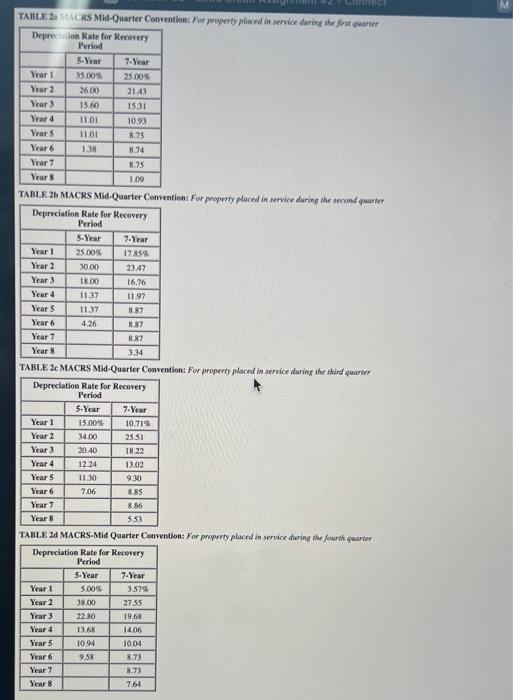
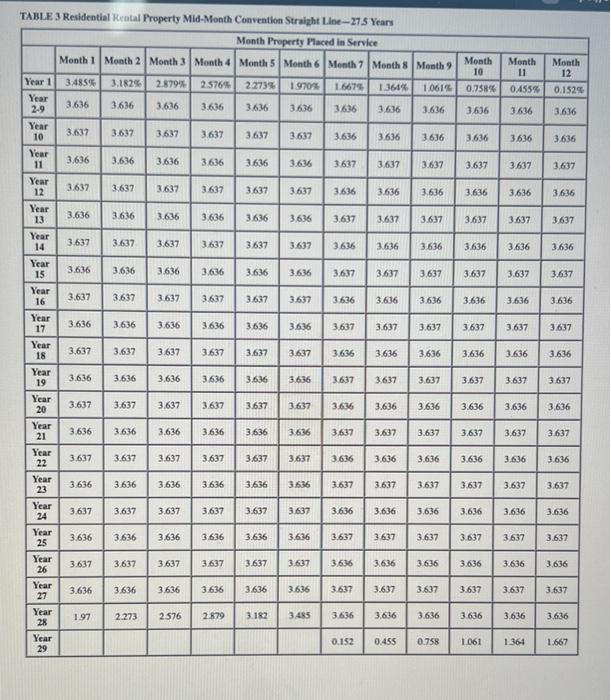
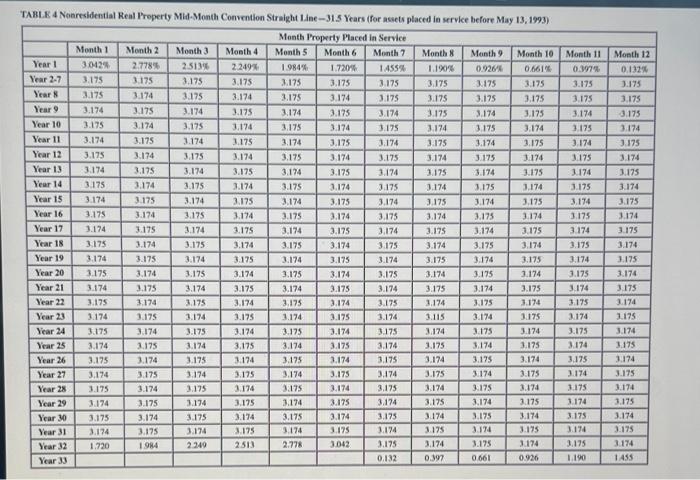
Required information [The following information applies to the questions displayed below) On March 14 of year 1, Javier purchased a building, including the land it was on, to assemble his new equipment. The total cost of the purchase was $1,475,500: $328,000 was allocated to the basis of the land and the remaining $1147,500 was allocated to the basis of the building. (Use MACRS Table 1. Table 2. Table 3. Table 4 and Table 5.) (Do not round Intermediate calculations. Round your answers to the nearest whole dollar amount.) a. Using MACRS, what is Javier's depreciation deduction on the building for years 1 through 3? Depreciation Expense Year 1 Year 2 Year 3 Required information [The following information applies to the questions displayed below) On March 14 of your 1, Javier purchased a building, including the land it was on, to assemble his new equipment. The total cost of the purchase was $1.475,500 $328,000 was allocated to the basis of the land and the remaining $1,147,500 was allocated to the basis of the building (Use MACRS Table 1. Table 2. Table 3. Toble 4 and Toble 5) (Do not round Intermediate calculations, Round your answers to the nearest whole dollar amount) b. What would be the year 3 depreciation deduction if the building was sold on January 8 of year 3? Year 3 depreciation deduction Required information [The following information applies to the questions displayed below) On March 14 of year 1, Javier purchased a bullding, including the land it was on, to assemble his new equipment. The total cost of the purchase was $1,475,500; $328,000 was allocated to the basis of the land and the remaining $1147,500 was allocated to the basis of the building (Use MACRS Table 1. Table 2. Table 3. Table 4 and Table 5) (Do not round Intermediate calculations. Round your answers to the nearest whole dollar amount.) c. Assume the building was purchased and placed in service on December 7 instead of March 14. Using MACRS, what is Javier's depreciation deduction on the building for years 1 through 3? Depreciation Deduction Year 1 Year 2 Year 3 Table 1 MACRS Half-Year Convention 20-Year Year 1 Year 2 Year 3 3.750% 7.219 Year 4 Depreciation Rate for Recovery Period 3-Year 5-Year 7-Year 10-Year 15-Year 33.33% 20.00% 14.29% 10.00% 5.00% 44.45 32.00 24.49 18.00 9.50 14.81 19.20 17.49 14.40 8.55 7.41 11.52 12.49 11.52 7.70 11.52 8.93 9.22 6.93 5.76 8.92 7.37 6.23 8.93 6.55 5.90 4.46 6.55 5.90 6.56 5.91 6.55 5.90 3.28 5.91 5.90 6.677 6.177 5.713 5.285 Year 5 Year 6 Year 7 Year 8 Year 9 Year 10 Year 11 Year 12 4.888 4.522 4.462 4.461 4.462 4.461 4.462 Year 13 Year 14 5.91 4.461 5.90 5.91 2.95 Year 15 Year 16 Year 17 Year 18 Year 19 Year 20 Year 21 4.462 4.461 4.462 4.461 4.462 4.461 2.231 TABLE 2 SACRS Mid-Quarter Convention. For property placed in service during the first quarter Deprecon Rate for Recovery Period 5-Year 7. Year Year 1 35.00 25.00 Year 2 26.00 2143 Year 3 15.60 15:31 Year 4 110 10.93 Years 1101 8.75 Year 6 1.38 8.74 Year 7 8.75 Year 109 TABLE 26 MACRS Mid-Quarter Convention For property placed in service during the second quarter Depreciation Rate for Recovery Period 5-Year 7. Year Year 1 25.00% 1785% Year 2 30.00 2347 Year 3 18.00 16.76 Year 4 11.37 1197 Year 5 11.37 887 Year 6 4.26 887 Year 7 8.87 Years 3.34 TABLE 2 MACRS Mid-Quarter Convention For property placed in service during the third quarter Depreciation Rate for Recovery Period 5-Year 7-Year Year 1 15.00% 10.71% Year 2 3400 25.51 Year 3 20 40 18.22 Year 4 12.24 13.02 Year 5 11.30 9.30 Year 6 7.06 8.85 Year 7 8.86 Years 553 TABLE 24 MACRS-Mid Quarter Convention: For property placed in service during the fourth quarter Depreciation Rate for Recovery Period 5-Year 7-Year Year 1 5.00% 3.579 Year 2 38.00 27.55 Year 3 22.30 19.68 Year 4 14.06 Year 5 1004 Year 6 9.58 8.73 Year 7 8.73 Year 7.64 LLLLL 10 TIL TABLE 3 Residential Rental Property Mid-Month Convention Straight Line --27.5 Years Month Property Placed in Service Month 1 Month 2 Month 3 Month 4 Month 3 Month 6 Month 7 Month 3 Month 9 Month 10 0.758% Month 11 0455% Month 12 3.485 3.1825 2.879% 2.5766 22735 1970% 1.6675 1.3646 1061 0.152 3.636 3636 3.636 3.636 3.636 3.636 3636 3636 3.636 3.636 3636 3,636 3.637 3.637 3.637 3.637 3.637 3.637 3.636 3.636 3.636 3.636 3.636 3.636 3.636 3.636 3.636 3.636 3.636 3.636 3.637 3.637 3.637 3.637 3637 1.637 3.632 3.637 3.637 3.637 3.637 3637 3636 3.636 3.636 3.636 3,636 3.636 3.636 3.636 3.636 3.636 3.636 3.636 3.637 3.637 3.637 3.637 3.637 3.637 3.637 E 3.637 3.637 3,637 3637 3.637 3.635 3.636 3.636 3.636 3.636 3.636 3.636 3.636 3.636 3,636 3.636 3.636 3.637 3.637 3.637 3,637 3.637 3.637 E 3.637 3.637 3.637 3.637 3.637 3.637 3.636 3.636 3.636 3.636 3.636 3.636 Year 1 Year 2-9 Year 10 Year 11 Year 12 Year 13 Year 14 Year 15 Year 16 Year 17 Year 18 Year 19 Year 20 Year 21 Year 22 Year 23 Year 24 Year 25 3.636 3.636 3.636 3.636 3.636 3.636 3.637 3.637 3.637 3.637 3637 3.637 3.637 3.637 3.637 3.637 3.637 3.637 3.636 3636 3,636 3.636 3.636 3.636 3.636 3.636 3.636 3.636 3.636 3.636 3.637 3.637 3.637 3.637 3.637 3.637 3.637 3.637 3.637 3.637 3.637 3.637 3.636 3.636 3.636 3.636 3,636 3,636 3.636 3.636 3.636 3.636 3.636 3.636 3.637 3.637 3.637 3.637 3.637 3.637 3.637 3.637 3.637 3.637 3.637 3.637 3636 3.636 3.636 3.636 3.636 3.636 3.636 3.636 3.636 3.636 3636 3.636 3.637 3.637 3.637 3.637 3.637 3.637 3.637 3.637 3.637 3.637 3.637 3.637 3.636 3.636 3.636 3.636 3.636 3.636 E 3.636 3,636 3.636 3.636 3.636 3.636 3.637 3637 3.637 3.637 3.637 3.637 Year 3.637 3.637 3.637 3.637 3.637 3.637 3.636 3.636 3.636 3.636 3.636 3.636 26 Year 27 3.636 3.636 3.636 3.636 3.636 3.636 3.637 3.637 3.637 3.637 3.637 3.637 1.97 2.273 2576 2879 3.182 3.485 3.636 3.636 3.636 3.636 3.636 3.636 Year 28 Year 29 0.152 0.455 0.758 1901 1.364 1.667 Month 11 0.1973 3.175 3.175 3.174 3.175 3.174 3.175 3.174 3.175 Month 12 0.132 3.175 3.175 3.175 3.174 3.175 3.174 3.175 3.174 3.175 3.174 3.174 3.175 3.174 3.174 TABLE4 Nonresidential Real Property Mid-Month Convention Straight Line -- 31.5 Years (for assets placed in service before May 13, 1993) Month Property Placed in Service Month 1 Month 2 Month 3 Month 4 Month 5 Month 6 Month 7 Month 8 Month 9 Month 10 Year 1 30123 2.778 2.513 2.249% 1984% 1.7204 1455 0.926% 0.661 Year 2-7 3.175 3.175 3.175 3.175 3.175 3.175 3.175 3.175 3.175 3.175 Year 3.175 3.174 3.175 3.174 3.175 3.174 3.175 3.175 3.175 3.175 Year 3.174 3.175 3.174 3.175 3.174 3.175 3.174 3.175 3.174 3.175 Year 10 3.175 3.174 3.175 3.174 3.175 3.174 3.175 3.174 3.174 Year 11 3.174 3.175 1.174 3.175 3.174 3.175 3.174 3.175 3.174 3.175 Year 12 3.175 3.174 3.175 3.174 3.175 3.174 3.175 3.174 3.175 3.174 Year 13 3.174 3.175 3.174 3.175 3.175 3.174 3.175 3.174 3.175 Year 14 3.175 3.174 3.175 3.174 3.175 3.174 3.175 3.174 3.175 J.174 Year 15 3.174 3.175 3.174 3.175 3.174 3.175 3.174 3.175 3.174 3.175 Year 16 3.175 3.174 3.175 3.175 3.174 3.175 3.174 3.175 3.174 Year 17 3.174 3.175 3.174 3.175 3.174 3.175 3.174 3.175 3.174 3.175 Year 18 3.175 3.174 3.175 3.174 3.175 3.174 3.175 3.174 3.175 3.174 Year 19 3.174 3.175 3.174 3.175 3.174 3.175 3.174 3.175 3.174 3.175 Year 20 3.175 3.174 3.175 3.175 3.174 3.175 3.174 3.175 3.174 Year 21 3.174 3.175 3.174 3.175 3.174 3.175 3.174 3.175 3.174 3.175 Year 22 3.175 3.174 3.175 3.174 3.175 3.174 3.175 3.174 3.125 3.174 Year 23 3.174 3.175 3.174 3.175 3.174 3.175 3.174 3.115 3.174 3.75 Year 24 3.175 3.174 3.175 3.174 3.175 3.174 3.175 3.174 3.175 3.174 Year 25 3.174 3.175 3.174 3.175 3.174 3.175 3.174 3.175 3.174 3.175 Year 26 3.175 3.174 3.175 1.174 3.175 3.174 3.175 3.174 3.175 3.174 Year 27 3.174 3.175 3.174 3.175 3.174 3.175 3.174 3.175 3.174 3.175 Year 28 3.175 3.174 3.175 1174 3:175 3.174 3.175 3.174 3.175 3.174 Year 29 3.174 3.175 3.174 3.175 3.174 3.175 3.174 3.175 3.174 3.175 Year 30 3.175 3.174 3.175 3.174 3.175 3.174 3.175 3.174 3.175 3.174 Year 31 3.174 3.175 3.174 3.175 3.174 3.175 3.174 3.174 3.175 Year 32 1.720 1984 2.349 2513 2.778 3.042 3.175 3.174 3.125 1174 Year 33 0.132 0.997 0.661 0.926 3.175 3 174 3.175 3175 3.174 3.174 3.175 3.174 3.175 1174 3.175 3.174 3.175 3.174 3.175 3.174 3.175 3.174 1175 3.174 3.175 3.174 3.174 J.175 1.175 3.174 1.175 3.174 3.175 3.174 3.175 . LLL 3.174 3.175 3 174 1455 1.175 1.190 TABLE 5 Nonresidential Real Property Mid-Month Convention Straight Line 9 Years (for assets placed in service on or after May 13, 1993) Month Property Placed in Service Month 1 Month 2 Month 3 Month 4 Month 5 Month 6 Month 7 Month Month 9 Month 10 Year 1 2.4615 2.2474 20335 18198 1605 13914 1.1778 0.963% 0.7499 OSIS Year 2-39 2564 2561 2564 2564 2.564 2564 2.564 2.564 2564 2564 Year 40 0.107 0.121 0.535 0.749 0.963 1.172 1.391 1.60S 1819 2013 Month 11 0.3213 2566 2247 Month 12 0.1075 2564 2.461
