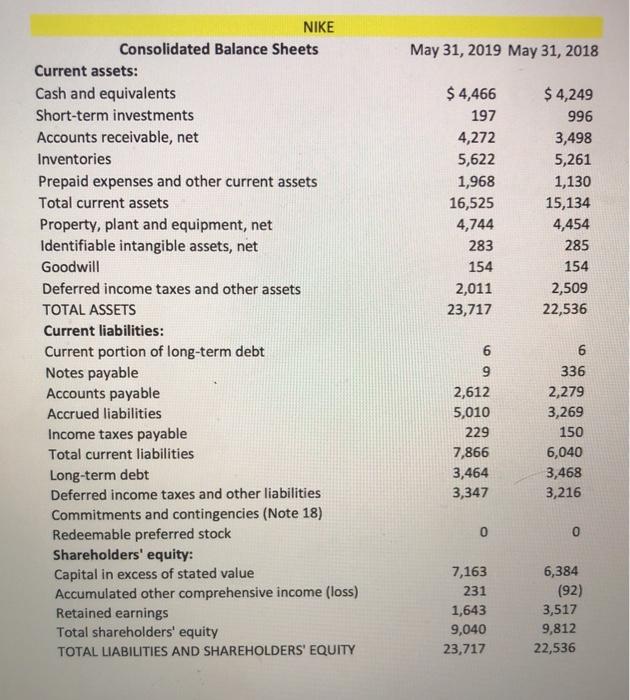
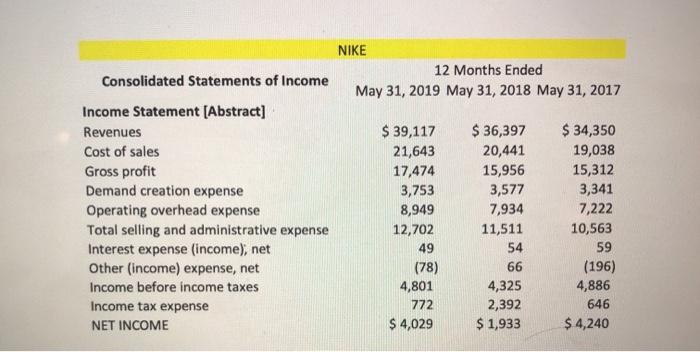
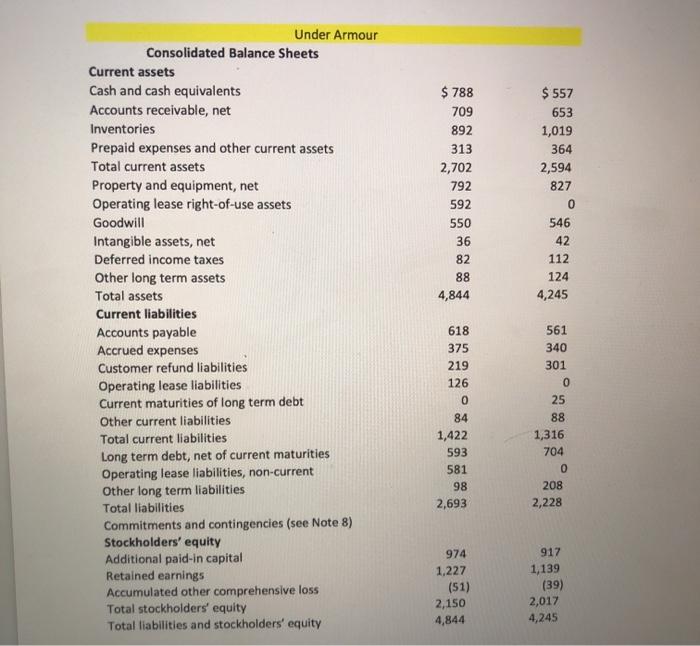
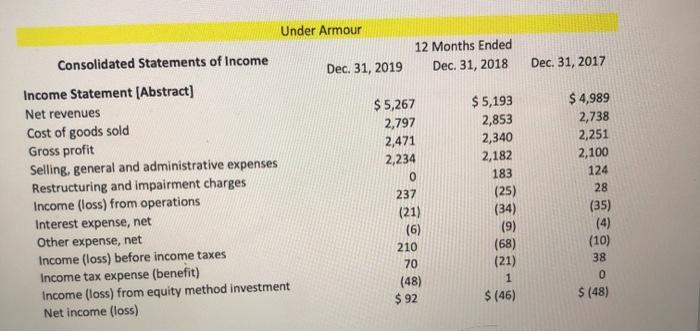
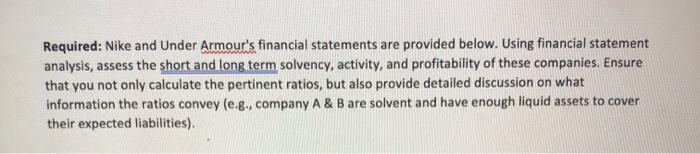
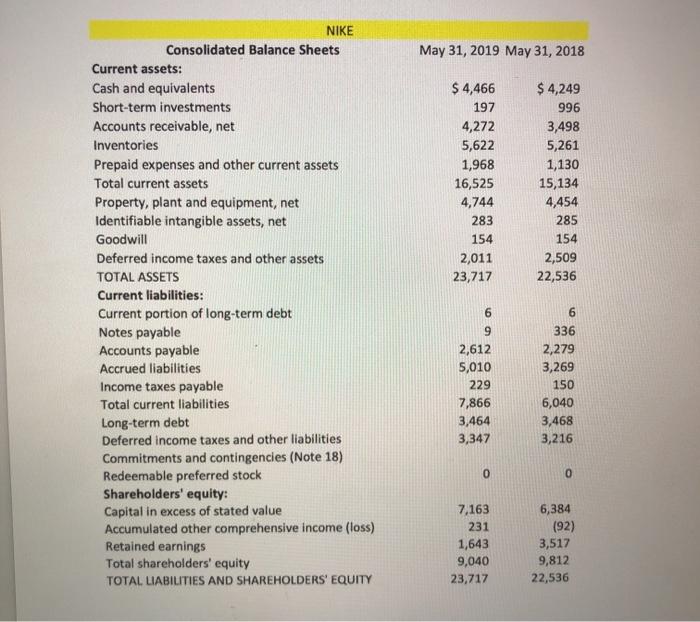
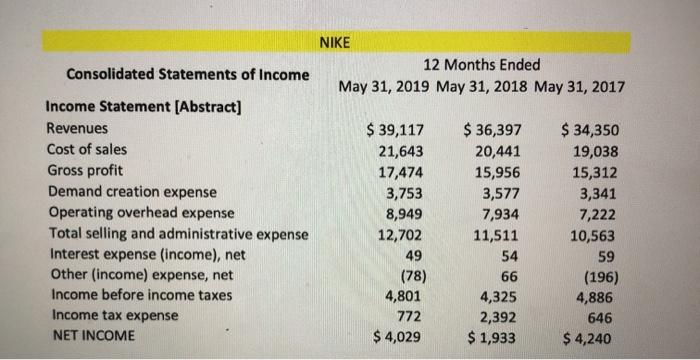
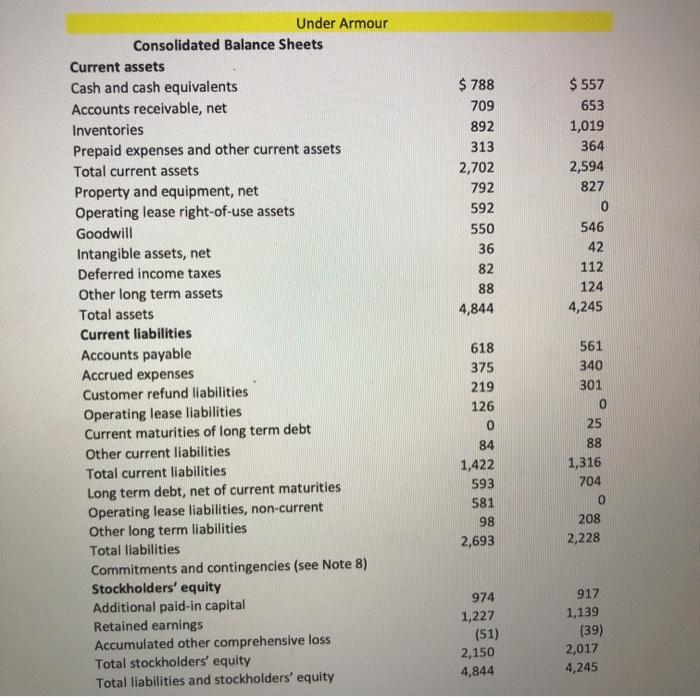
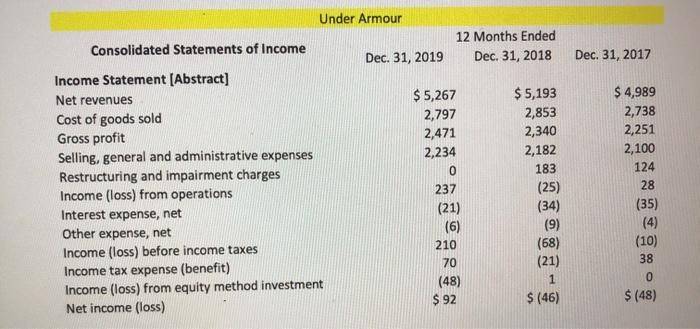
Required: Nike and Under Armour's financial statements are provided below. Using financial statement analysis, assess the short and long term solvency, activity, and profitability of these companies. Ensure that you not only calculate the pertinent ratios, but also provide detailed discussion on what information the ratios convey (e.g., company A & B are solvent and have enough liquid assets to cover their expected liabilities). May 31, 2019 May 31, 2018 $ 4,466 197 4,272 5,622 1,968 16,525 4,744 283 154 2,011 23,717 $ 4,249 996 3,498 5,261 1,130 15,134 4,454 285 154 2,509 22,536 NIKE Consolidated Balance Sheets Current assets: Cash and equivalents Short-term investments Accounts receivable, net Inventories Prepaid expenses and other current assets Total current assets Property, plant and equipment, net Identifiable intangible assets, net Goodwill Deferred income taxes and other assets TOTAL ASSETS Current liabilities: Current portion of long-term debt Notes payable Accounts payable Accrued liabilities Income taxes payable Total current liabilities Long-term debt Deferred income taxes and other liabilities Commitments and contingencies (Note 18) Redeemable preferred stock Shareholders' equity: Capital in excess of stated value Accumulated other comprehensive income (loss) Retained earnings Total shareholders' equity TOTAL LIABILITIES AND SHAREHOLDERS' EQUITY 6 9 2,612 5,010 229 7,866 3,464 3,347 6 336 2,279 3,269 150 6,040 3,468 3,216 0 7,163 231 1,643 9,040 23,717 6,384 (92) 3,517 9,812 22,536 Consolidated Statements of Income NIKE 12 Months Ended May 31, 2019 May 31, 2018 May 31, 2017 Income Statement [Abstract] Revenues Cost of sales Gross profit Demand creation expense Operating overhead expense Total selling and administrative expense Interest expense (income), net Other (income) expense, net Income before income taxes Income tax expense NET INCOME $ 39,117 21,643 17,474 3,753 8,949 12,702 49 (78) 4,801 772 $ 4,029 $36,397 20,441 15,956 3,577 7,934 11,511 54 66 4,325 2,392 $ 1,933 $ 34,350 19,038 15,312 3,341 7,222 10,563 59 (196) 4,886 646 $ 4,240 $ 788 709 892 313 2,702 792 592 550 36 82 88 4,844 $ 557 653 1,019 364 2,594 827 0 546 42 112 124 4,245 Under Armour Consolidated Balance Sheets Current assets Cash and cash equivalents Accounts receivable, net Inventories Prepaid expenses and other current assets Total current assets Property and equipment, net Operating lease right-of-use assets Goodwill Intangible assets, net Deferred income taxes Other long term assets Total assets Current liabilities Accounts payable Accrued expenses Customer refund liabilities Operating lease liabilities Current maturities of long term debt Other current liabilities Total current liabilities Long term debt, net of current maturities Operating lease liabilities, non-current Other long term liabilities Total liabilities Commitments and contingencies (see Note 8) Stockholders' equity Additional paid-in capital Retained earnings Accumulated other comprehensive loss Total stockholders' equity Total liabilities and stockholders' equity 618 375 219 126 0 84 1,422 593 581 98 2,693 561 340 301 0 25 88 1,316 704 0 208 2,228 974 1,227 (51) 917 1,139 (39) 2,017 4,245 2,150 4,844 Under Armour 12 Months Ended Dec. 31, 2018 Consolidated Statements of Income Dec 31, 2019 Dec 31, 2017 Income Statement (Abstract) Net revenues Cost of goods sold Gross profit Selling, general and administrative expenses Restructuring and impairment charges Income (loss) from operations Interest expense, net Other expense, net Income (loss) before income taxes Income tax expense (benefit) Income (loss) from equity method investment Net income (loss) $ 5,267 2,797 2,471 2,234 0 237 (21) (6) 210 70 (48) $92 $5,193 2,853 2,340 2,182 183 (25) (34) (9) (68) (21) 1 $ (46) $ 4,989 2,738 2,251 2,100 124 28 (35) (10) 38 0 $ (48) Required: Nike and Under Armour's financial statements are provided below. Using financial statement analysis, assess the short and long term solvency, activity, and profitability of these companies. Ensure that you not only calculate the pertinent ratios, but also provide detailed discussion on what information the ratios convey (e.g., company A & B are solvent and have enough liquid assets to cover their expected liabilities). May 31, 2019 May 31, 2018 $ 4,466 197 4,272 5,622 1,968 16,525 4,744 283 154 2,011 23,717 $ 4,249 996 3,498 5,261 1,130 15,134 4,454 285 154 2,509 22,536 NIKE Consolidated Balance Sheets Current assets: Cash and equivalents Short-term investments Accounts receivable, net Inventories Prepaid expenses and other current assets Total current assets Property, plant and equipment, net Identifiable intangible assets, net Goodwill Deferred income taxes and other assets TOTAL ASSETS Current liabilities: Current portion of long-term debt Notes payable Accounts payable Accrued liabilities Income taxes payable Total current liabilities Long-term debt Deferred income taxes and other liabilities Commitments and contingencies (Note 18) Redeemable preferred stock Shareholders' equity: Capital in excess of stated value Accumulated other comprehensive income (loss) Retained earnings Total shareholders' equity TOTAL LIABILITIES AND SHAREHOLDERS' EQUITY 6 9 2,612 5,010 229 7,866 3,464 3,347 6 336 2,279 3,269 150 6,040 3,468 3,216 0 0 7,163 231 1,643 9,040 23,717 6,384 (92) 3,517 9,812 22,536 Consolidated Statements of Income NIKE 12 Months Ended May 31, 2019 May 31, 2018 May 31, 2017 Income Statement [Abstract] Revenues Cost of sales Gross profit Demand creation expense Operating overhead expense Total selling and administrative expense Interest expense (income), net Other (income) expense, net Income before income taxes Income tax expense NET INCOME $ 39,117 21,643 17,474 3,753 8,949 12,702 49 (78) 4,801 772 $ 4,029 $36,397 20,441 15,956 3,577 7,934 11,511 54 66 4,325 2,392 $ 1,933 $ 34,350 19,038 15,312 3,341 7,222 10,563 59 (196) 4,886 646 $ 4,240 $ 788 709 892 313 2,702 792 592 550 36 82 88 4,844 $ 557 653 1,019 364 2,594 827 0 546 42 112 124 4,245 Under Armour Consolidated Balance Sheets Current assets Cash and cash equivalents Accounts receivable, net Inventories Prepaid expenses and other current assets Total current assets Property and equipment, net Operating lease right-of-use assets Goodwill Intangible assets, net Deferred income taxes Other long term assets Total assets Current liabilities Accounts payable Accrued expenses Customer refund liabilities Operating lease liabilities Current maturities of long term debt Other current liabilities Total current liabilities Long term debt, net of current maturities Operating lease liabilities, non-current Other long term liabilities Total liabilities Commitments and contingencies (see Note 8) Stockholders' equity Additional paid-in capital Retained earnings Accumulated other comprehensive loss Total stockholders' equity Total liabilities and stockholders' equity 618 375 219 126 0 84 1,422 593 581 98 2,693 561 340 301 0 25 88 1,316 704 0 208 2,228 974 1,227 (51) 2,150 4,844 917 1,139 (39) 2,017 4,245 Under Armour Consolidated Statements of Income 12 Months Ended Dec 31, 2018 Dec. 31, 2019 Dec. 31, 2017 Income Statement(Abstract] Net revenues Cost of goods sold Gross profit Selling, general and administrative expenses Restructuring and impairment charges Income (loss) from operations Interest expense, net Other expense, net Income (loss) before income taxes Income tax expense (benefit) Income (loss) from equity method investment Net income (loss) $ 5,267 2,797 2,471 2,234 0 237 (21) (6) 210 70 (48) $ 92 $5,193 2,853 2,340 2,182 183 (25) (34) (9) (68) (21) 1 $ (46) $ 4,989 2,738 2,251 2,100 124 28 (35) (4) (10) 38 0 $ (48)