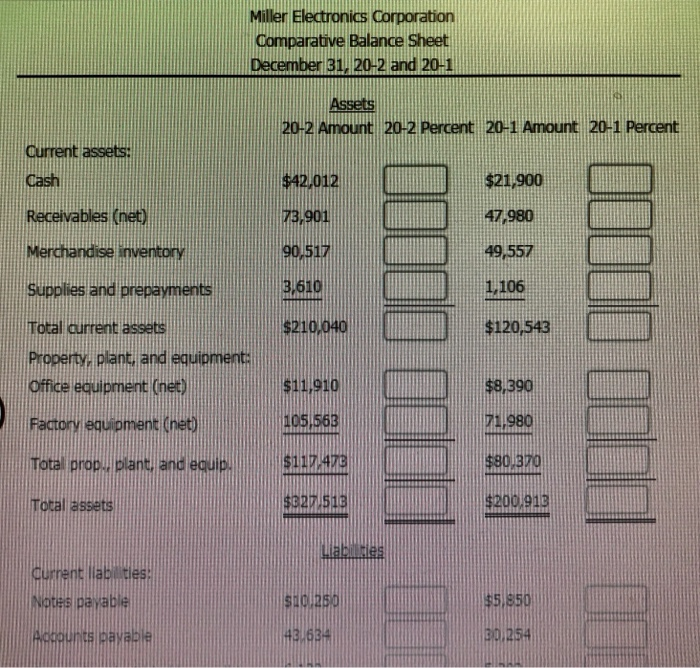
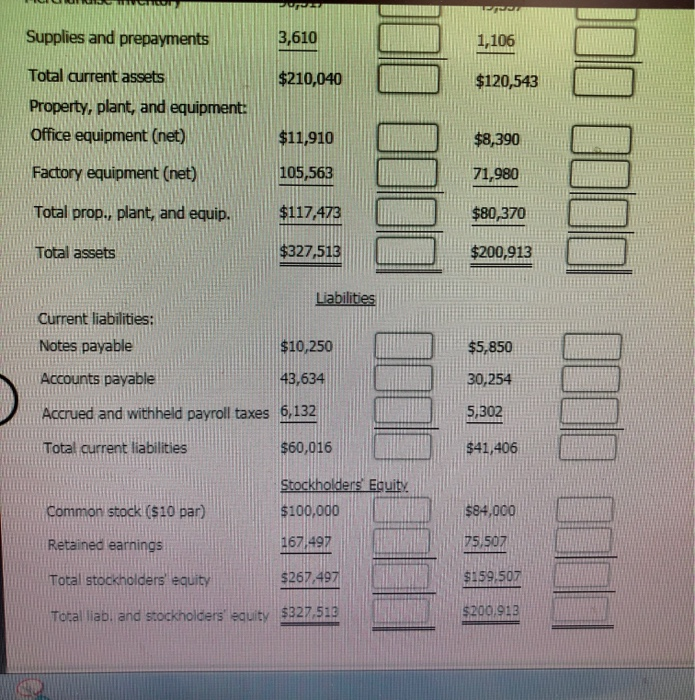
Required:
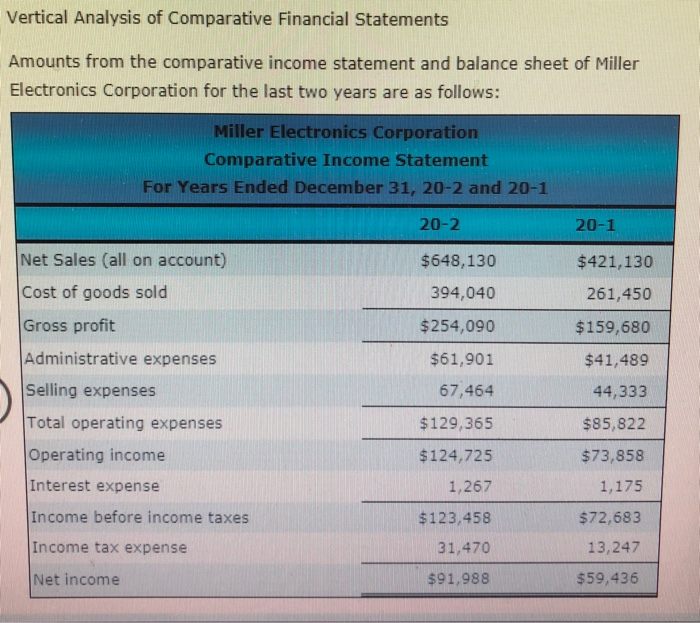
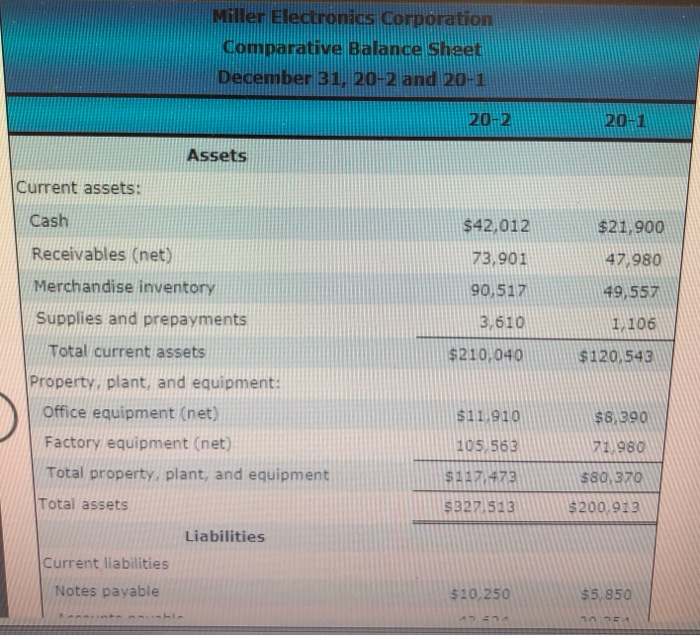
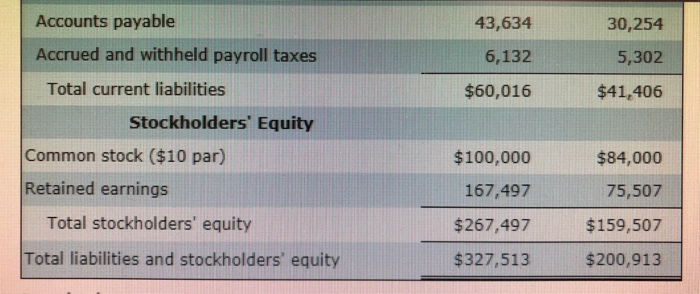
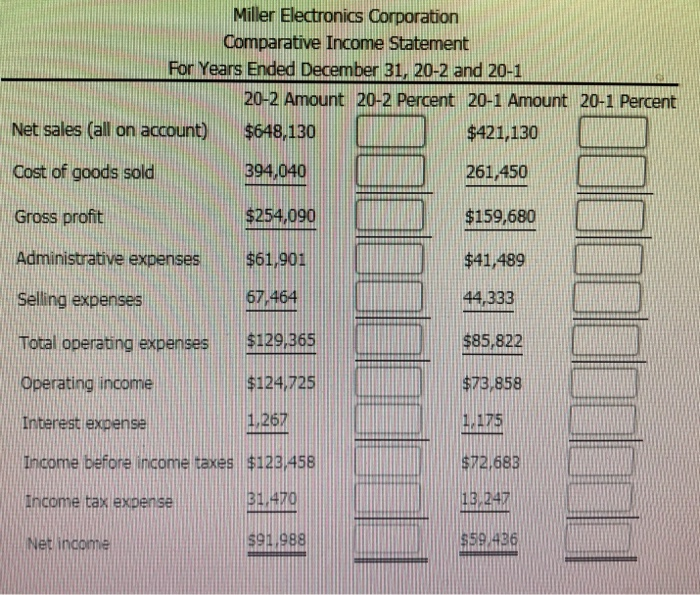
Prepare a vertical analysis of the income statement and balance sheet. Show each item on the income statement as a percentage of the net sales for each year. On the balance sheet, show each asset item as a percentage of the total assets and each liability and equity item as a percentage of the total liabilities and stockholders' equity. Round percentages to one decimal place. Do not enter the percent sign. For example, 60% would be entered as 60.
Vertical Analysis of Comparative Financial Statements Amounts from the comparative income statement and balance sheet of Miller Electronics Corporation for the last two years are as follows: Miller Electronics Corporation Comparative Income Statement For Years Ended December 31, 20-2 and 20-1 20-2 20-1 Net Sales (all on account) Cost of goods sold Gross profit Administrative expenses Selling expenses Total operating expenses Operating income Interest expense Income before income taxes Income tax expense Net income $648,130 394,040 $254,090 $61,901 67,464 $129,365 $124,725 1,267 $123,458 31,470 $91,988 $421,130 261,450 $159,680 $41,489 44,333 $85,822 $73,858 1,175 $72,683 13,247 $59,436 Miller Electronics Corporation Comparative Balance Shaet December 31, 20-2 and 20-1 20-2 201 Assets Current assets: Cash Receivables (net) Merchandise inventory Supplies and prepayments $42,012 73.901 90,517 3.610 $210,040 $21,900 47.980 49,557 1.106 $120,543 Total current assets Property, plant, and equipment Office equipment (net) Factory equipment (net) Total property, plant, and equipment Total assets $11.910 105,563 $117 473 $327 513 $8,390 71 980 $80.370 $200,923 Liabilities Current liabilities Notes payable $10,250 $5,950 Accounts payable Accrued and withheld payroll taxes 43,634 6,132 $60,016 30,254 5,302 $41,406 Total current liabilities Stockholders Equity Common stock ($10 par) Retained earnings $100,000 167,497 $267,497 $327,513 $84,000 75,507 $159,507 $200,913 Total stockholders' equity Total liabilities and stockholders' equity Miller Electronics Corporation Comparative Income Statement For Years Ended December 31, 20-2 and 20-1 20-2 Amount 20-2 Percent 20-1 Amount 20-1 Percent ] ] -] Net sales (all on account) $648,130 394,040 $254,099 $421,130 261,450 $159,680 Cost of goods sold Gross profit Administrative expenses$61.901 Selling expenses Total operating expenses$129365 Operating income Interest expense Income before income taxes s123458 $41,489 44 333 $85,822 $73,858 1.175 $72.683 13, 247 $59 436 67 4641433 $124/725 1,267 Frcome tax expiense 31 470 Net income $91 988 Miller Electronics Corporation Comparative Balance Sheet December 31. 20-2 and 20-1 Assets 20-2 Amount 20-2 Percent 20-1 Amount 20-1 Percent Current assets: Cash Receivables (net) ) [) $21/900 47,980 49,557 1,106 $42,012 90 517 3.610 Supplies a Total current assets Property, plant, and eaui Office equipment (net) Factory eduipment (net) Total prop Total assets C $210,040 $120,543 $11/910 8.300 71.980 105 563 Tota prop.. Pilant and eduip.S1ZA23 sBola70 $327 518 $200 915 rrent llabi ties Notes pavable $HCU2SD s4CIRBD $51850 H3/634 301254 Supplies and prepayments 3,610 1,106 $210,040 [ ] $120,543 [ ) ( Total arrent assets Property, plant, and equipment Office equipment (net) $11,910 ) $8,390 105,563 71,980 Total prop, plant, and equip. $117473 $327,513 l$80,370 Total assets $200,913 Liabilities Current liabilities: Notes payable Accounts payable Accrued and withheld payroll taxes 6,132 Total current liabilities $10,250 43,634 30,254 5,302 $41,406 $60,016 Common stock (s10 par) Retained earnings Total stockholders equity toral liab, and stockholders equity $327.51 $84,000 75,507 $159507 167 497 eouty267498159 50 5327-513200.232
