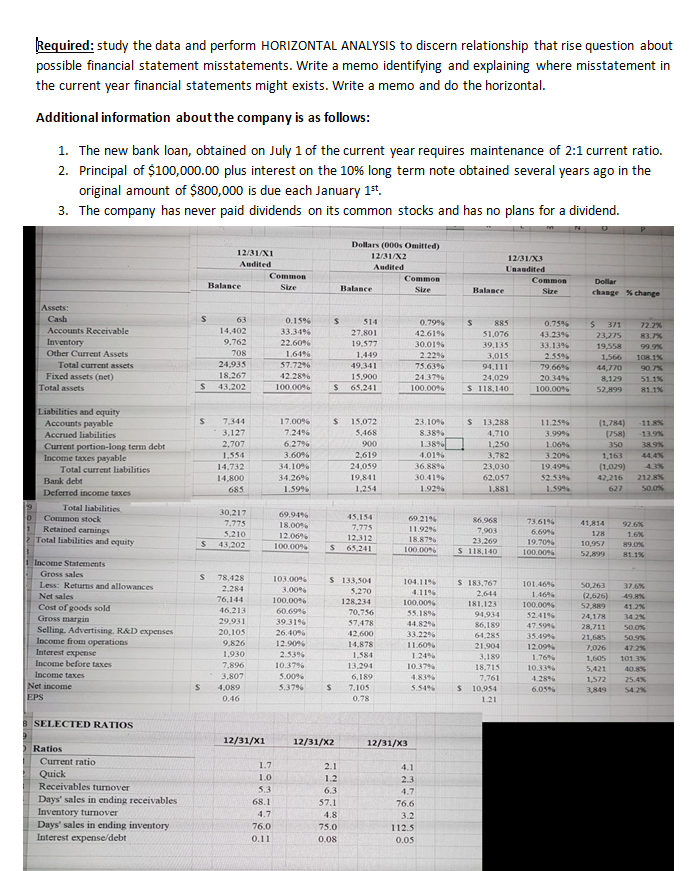
Required: study the data and perform HORIZONTAL ANALYSIS to discern relationship that rise question about possible financial statement misstatements. Write a memo identifying and explaining where misstatement in the current year financial statements might exists. Write a memo and do the horizontal. Additional information about the company is as follows: 1. The new bank loan, obtained on July 1 of the current year requires maintenance of 2:1 current ratio. 2. Principal of $100,000.00 plus interest on the 10% long term note obtained several years ago in the original amount of $800,000 is due each January 1st. 3. The company has never paid dividends on its common stocks and has no plans for a dividend. 12/31/X1 Audited Common Balance Sure Dollars (000s Omitted) 12/81/X2 Audited 12/31/X3 Unaudited Common Size Balance Dollar change % change 0.15% $ 63 14.102 9.762 Assets: Cash Accounts Receivable Inventory Other Current Assets Total current assets Fixed assets (net) Total assets 22.6096 0.7996 42.6196 30.01% 2.22% 708 514 27.801 19 577 1.449 49341 15.900 65.241 1.6196 57.7296 42.2896 885 51,076 39.135 3,015 91,111 24,029 $ 118,140 0.7596 43.2396 33.1396 2.5596 79.6696 20 3496 100.0096 $ 371 20275 1955 1,566 44,770 8,129 52,899 22.2% 37% 99.98 108.1% 90.7% 51.1% 81.1% 24.935 18.267 43,202 24.3796 100.0096 $ 100.0096 $ S Liabilities and equity Accounts payable Accrued liabilities Current portion-long term debt Income taxes payable Total current liabilities Bank debt Deferred income taxes Total liabilities Common stock Retained earnings Total liabilities and equity 7,344 3.127 2,707 1.554 14,732 14,800 085 17 0096 7.24% 62796 3.6096 34.106 15,072 5.468 200 2.619 24.059 19,841 1.254 23.106 8.3896 1.3896 40196 36.88% 30.41% 1.92% 13,288 4,710 1,250 3,782 23.030 62,057 1.881 11.256 3.9996 1.06% 3 20% 19.49% $2.5396 1.596 (1,784) (758) 350 1.163 (1.029) 42,216 627 11 8 13.9% 8.9% 4 4.4% 4.3% 212.8% 0.0% 34.2696 1.5996 9 0 1 30.217 41,814 7.75 5.210 92.6% 69.9.196 18.00 12.06% 100.0096 45.154 7,775 12.312 65.241 69.2196 11.9296 18.8796 100.000 73.6196 6.6996 86068 7.903 23.269 S 118,1:40 $ 43.202 19.06 S 10,957 52,899 9.0% 100.00% $ 49 1 Income Statements Gross sales Less: Returns and allowances Net sales Cost of goods sold Gross margin Selling Advertising, R&D expenses Income from operations Interest expense Income before taxes Income taxes Net income EPS 78,128 2.284 76,144 46.213 29.931 20.105 9,826 1040096 3.006 100.00% 60.6996 39 3196 26.1096 12.90% 2.5396 10.37% 5.0096 5.3796 133,504 5.270 128 234 70.756 57.478 42.600 14.878 1.580 13.204 6,189 7,105 0.78 1041196 4.1196 100.0096 55.1896 44.8296 33.2296 11.6096 1.246 10.3796 1.839 5.5496 $ 183,767 2.614 181.123 94.934 86,189 6025 21.904 3.189 18,715 7,761 $ 10.954 101.4696 1.46% 100.00 524196 47 5996 35.49% 12.0996 1.76 10.3396 4.2896 6059 50.263 2.626) 52 889 24,178 28,711 21.685 7,026 1,605 5.421 1.572 3849 142% SOOK SO 1.930 7.896 101.3% 40.8% 25.4% 3.807 4.089 0.46 8 SELECTED RATIOS 12/31/X1 12/31/X2 12/31/X3 4.1 1.7 10 5.3 68.1 1.2 Ratios Current ratio Quick Receivables turnover Days' sales in ending receivables Inventory tumover Days' sales in ending inventory Interest expense/debt 2.3 6.3 57.1 1.8 4.7 76.6 3.2 112.5 0.05 76.0 0.11 75.0 0.08 Required: study the data and perform HORIZONTAL ANALYSIS to discern relationship that rise question about possible financial statement misstatements. Write a memo identifying and explaining where misstatement in the current year financial statements might exists. Write a memo and do the horizontal. Additional information about the company is as follows: 1. The new bank loan, obtained on July 1 of the current year requires maintenance of 2:1 current ratio. 2. Principal of $100,000.00 plus interest on the 10% long term note obtained several years ago in the original amount of $800,000 is due each January 1st. 3. The company has never paid dividends on its common stocks and has no plans for a dividend. 12/31/X1 Audited Common Balance Sure Dollars (000s Omitted) 12/81/X2 Audited 12/31/X3 Unaudited Common Size Balance Dollar change % change 0.15% $ 63 14.102 9.762 Assets: Cash Accounts Receivable Inventory Other Current Assets Total current assets Fixed assets (net) Total assets 22.6096 0.7996 42.6196 30.01% 2.22% 708 514 27.801 19 577 1.449 49341 15.900 65.241 1.6196 57.7296 42.2896 885 51,076 39.135 3,015 91,111 24,029 $ 118,140 0.7596 43.2396 33.1396 2.5596 79.6696 20 3496 100.0096 $ 371 20275 1955 1,566 44,770 8,129 52,899 22.2% 37% 99.98 108.1% 90.7% 51.1% 81.1% 24.935 18.267 43,202 24.3796 100.0096 $ 100.0096 $ S Liabilities and equity Accounts payable Accrued liabilities Current portion-long term debt Income taxes payable Total current liabilities Bank debt Deferred income taxes Total liabilities Common stock Retained earnings Total liabilities and equity 7,344 3.127 2,707 1.554 14,732 14,800 085 17 0096 7.24% 62796 3.6096 34.106 15,072 5.468 200 2.619 24.059 19,841 1.254 23.106 8.3896 1.3896 40196 36.88% 30.41% 1.92% 13,288 4,710 1,250 3,782 23.030 62,057 1.881 11.256 3.9996 1.06% 3 20% 19.49% $2.5396 1.596 (1,784) (758) 350 1.163 (1.029) 42,216 627 11 8 13.9% 8.9% 4 4.4% 4.3% 212.8% 0.0% 34.2696 1.5996 9 0 1 30.217 41,814 7.75 5.210 92.6% 69.9.196 18.00 12.06% 100.0096 45.154 7,775 12.312 65.241 69.2196 11.9296 18.8796 100.000 73.6196 6.6996 86068 7.903 23.269 S 118,1:40 $ 43.202 19.06 S 10,957 52,899 9.0% 100.00% $ 49 1 Income Statements Gross sales Less: Returns and allowances Net sales Cost of goods sold Gross margin Selling Advertising, R&D expenses Income from operations Interest expense Income before taxes Income taxes Net income EPS 78,128 2.284 76,144 46.213 29.931 20.105 9,826 1040096 3.006 100.00% 60.6996 39 3196 26.1096 12.90% 2.5396 10.37% 5.0096 5.3796 133,504 5.270 128 234 70.756 57.478 42.600 14.878 1.580 13.204 6,189 7,105 0.78 1041196 4.1196 100.0096 55.1896 44.8296 33.2296 11.6096 1.246 10.3796 1.839 5.5496 $ 183,767 2.614 181.123 94.934 86,189 6025 21.904 3.189 18,715 7,761 $ 10.954 101.4696 1.46% 100.00 524196 47 5996 35.49% 12.0996 1.76 10.3396 4.2896 6059 50.263 2.626) 52 889 24,178 28,711 21.685 7,026 1,605 5.421 1.572 3849 142% SOOK SO 1.930 7.896 101.3% 40.8% 25.4% 3.807 4.089 0.46 8 SELECTED RATIOS 12/31/X1 12/31/X2 12/31/X3 4.1 1.7 10 5.3 68.1 1.2 Ratios Current ratio Quick Receivables turnover Days' sales in ending receivables Inventory tumover Days' sales in ending inventory Interest expense/debt 2.3 6.3 57.1 1.8 4.7 76.6 3.2 112.5 0.05 76.0 0.11 75.0 0.08


