Required:- 1. Complete the table by Calculating the ET for all months from 1 to 12 using the given data. 2. Plot ( use excel


Required:-
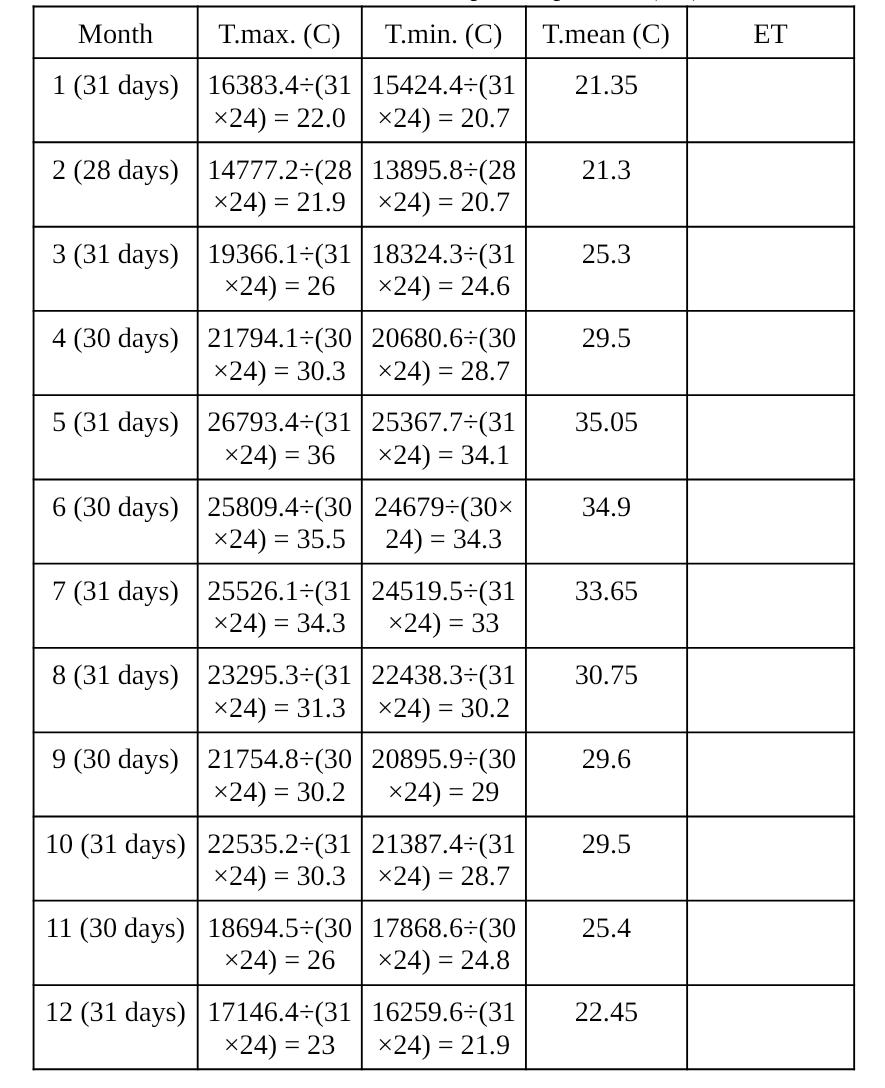
1. Complete the table by Calculating the ET for all months from 1 to 12 using the given data.
2. Plot ( use excel ) the relationship between average potential Evapotranspiration ET ( y-axis ) and Month ( x-axis ) .
3. what is your conclusion about the curve?
use computer font.
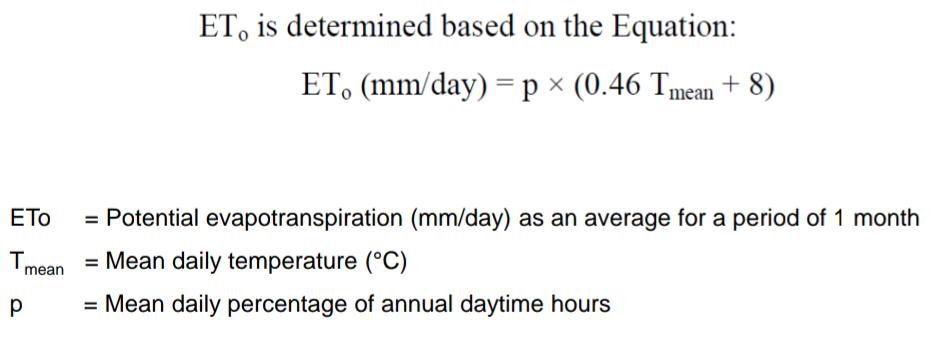
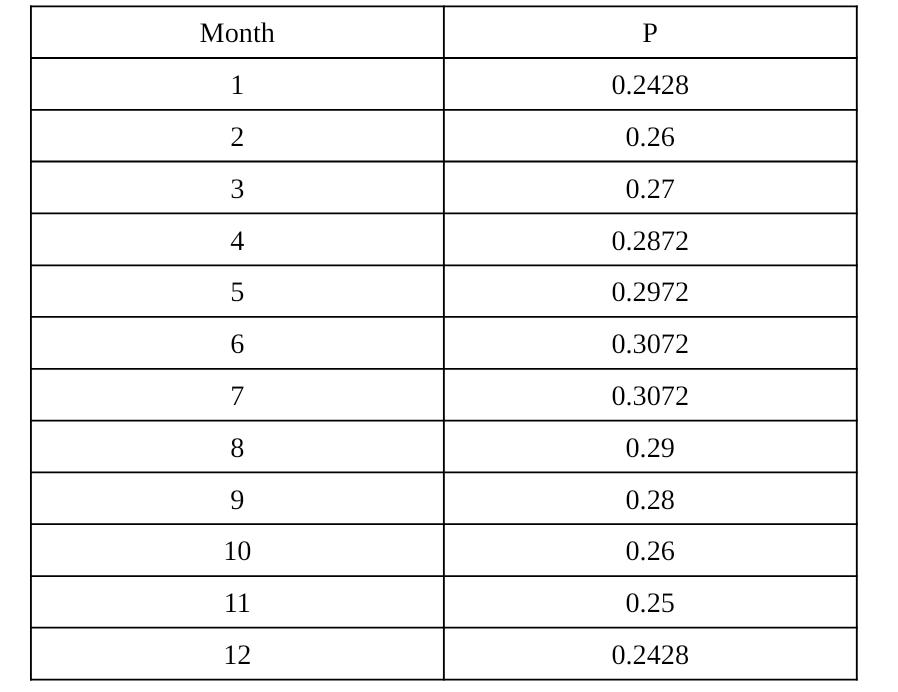
ET, is determined based on the Equation: ET (mm/day) = p (0.46 Tmean + 8) = Potential evapotranspiration (mm/day) as an average for a period of 1 month Tmean = Mean daily temperature (C) = Mean daily percentage of annual daytime hours Month 1 2 3 4 5 6 7 8 9 10 11 12 P 0.2428 0.26 0.27 0.2872 0.2972 0.3072 0.3072 0.29 0.28 0.26 0.25 0.2428 Month 1 (31 days) T.max. (C) T.min. (C) 16383.4(31 15424.4(31 24) = 22.024) = 20.7 2 (28 days) 14777.2(28| 13895.8+(28 24) = 21.9 24) = 20.7 3 (31 days) 19366.1(31 24) = 26 4 (30 days) 21794.1+(30 24) = 30.3 5 (31 days) 26793.4(31 24) = 36 7 (31 days) 25526.1(31 X24) = 34.3 8 (31 days) 23295.3(31 x24) = 31.3 6 (30 days) 25809.4(30 | 24679(30 X24) = 35.5 24) = 34.3 9 (30 days) 21754.8(30 24) = 30.2 10 (31 days) 22535.2(31 24) = 30.3 11 (30 days) 18694.5+(30 24) = 26 18324.3+(31 24) = 24.6 12 (31 days) 17146.4(31 24) = 23 20680.6+(30 X24) = 28.7 25367.7+(31 X24) = 34.1 24519.5+(31 X24) = 33 22438.3(31 24) = 30.2 20895.9+(30 24) = 29 21387.4(31 24) = 28.7 17868.6+(30 24) = 24.8 16259.6+(31 24) = 21.9 T.mean (C) 21.35 21.3 25.3 29.5 35.05 34.9 33.65 30.75 29.6 29.5 25.4 22.45 ET
Step by Step Solution
3.39 Rating (152 Votes )
There are 3 Steps involved in it
Step: 1
5 7 10 11 12 13 15 16 17 18 19 20 21 23 24 26 27 28 29 30 18 Foll EVAPOTRANSPIRATION VS MON...
See step-by-step solutions with expert insights and AI powered tools for academic success
Step: 2

Step: 3

Ace Your Homework with AI
Get the answers you need in no time with our AI-driven, step-by-step assistance
Get Started


