

Question
Requirement 1. Prepare income statements for Cool Ride Motors in April and May 2017 under throughput costing. Begin by completing the top portion of the
Requirement 1. Prepare income statements for Cool Ride Motors in April and May 2017 under throughput costing. Begin by completing the top portion of the statement, then the bottom portion. (Complete all answer boxes. Enter a "0" for any zero amounts.)
|
| April 2017 | May 2017 | |||||||
| Revenues |
|
|
|
| |||||
| Direct material cost of goods sold |
|
|
|
|
| ||||
| Beginning inventory |
|
|
|
|
| ||||
| Direct materials |
|
|
|
|
| ||||
| Cost of goods available for sale |
|
|
|
|
| ||||
| Deduct ending inventory |
|
|
|
|
| ||||
| Total direct material cost of goods sold |
|
|
|
| |||||
| Throughput margin |
|
|
|
| |||||
| Manufacturing costs |
|
|
|
| |||||
| Other operating costs |
|
|
|
| |||||
| Operating income |
|
|
|
| |||||
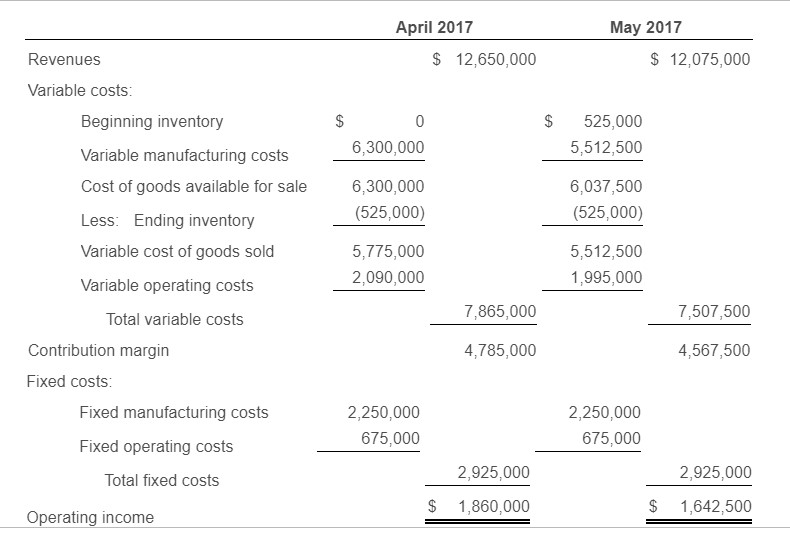
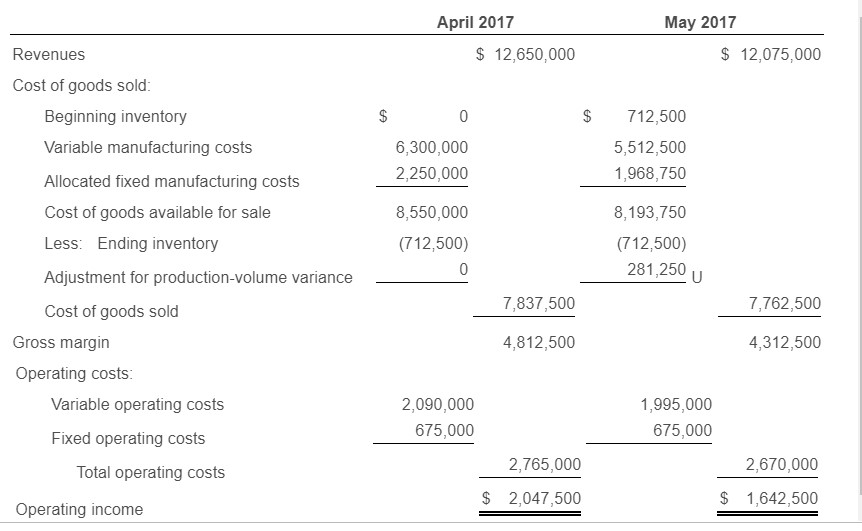
Requirement 2. Contrast the results in requirement 1 with the absorption and variable costing income statements presented.
In April, _____has the lowest operating income, whereas in May ________has the highest operating income. puts greater emphasis on sales as the source of operating income than does either _______
Requirement 3. Give one motivation for
Cool Ride Motors to adopt throughput costing.
costing puts a penalty on production without a corresponding sale in the same period. Costs other than direct materials that are variable with respect to production are
in the period of incurrence, whereas under variable costing they would be
.
As a result, provides less incentive to produce for inventory than either
absorption or variable costing
.
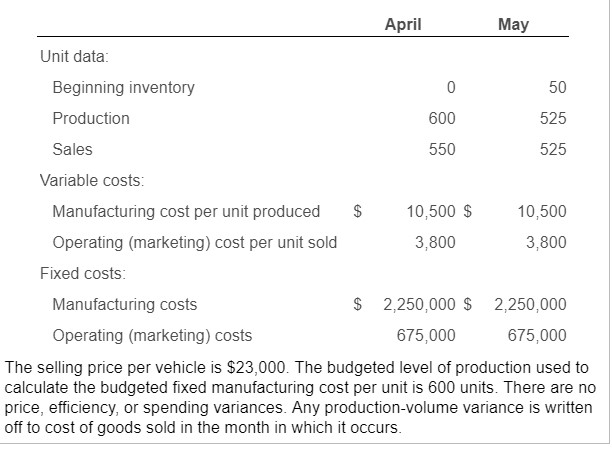
May April Unit data: Beginning inventory 50 525 Production 600 525 Sales 550 Variable costs: $ Manufacturing cost per unit produced 10,500 $ 10,500 Operating (marketing) cost per unit sold 3,800 3,800 Fixed costs: $ 2,250,000 $ 2,250,000 Manufacturing costs 675,000 Operating (marketing) costs 675,000 The selling price per vehicle is $23,000. The budgeted level of production used to calculate the budgeted fixed manufacturing cost per unit is 600 units. There are no price, efficiency, or spending variances. Any production-volume variance is written off to cost of goods sold in the month in which it occurs. April 2017 May 2017 $12,075,000 Revenues 12,650,000 Variable costs: Beginning inventory $ 525,000 0 6,300,000 5,512,500 Variable manufacturing costs Cost of goods available for sale 6,300,000 6,037,500 (525,000) (525,000) Less: Ending inventory Variable cost of goods sold 5,512,500 5,775,000 2,090,000 1,995,000 Variable operating costs 7,865,000 7,507,500 Total variable costs Contribution margin 4,785,000 4,567,500 Fixed costs: 2,250,000 2,250,000 Fixed manufacturing costs 675,000 675,000 Fixed operating costs 2,925,000 2,925,000 Total fixed costs $ 1,860,000 1,642,500 Operating income April 2017 May 2017 $12,650,000 12,075,000 Revenues Cost of goods sold: Beginning inventory 0 712,500 Variable manufacturing costs 6,300,000 5,512,500 2,250,000 1,968,750 Allocated fixed manufacturing costs Cost of goods available for sale 8,550,000 8,193,750 Less: Ending inventory (712,500) (712,500) 281,250 U 0 Adjustment for production-volume variance 7,837,500 7,762,500 Cost of goods sold Gross margin 4,812,500 4,312,500 Operating costs: Variable operating costs 2,090,000 1,995,000 675,000 675,000 Fixed operating costs 2,765,000 2,670,000 Total operating costs $ 2,047,500 $ 1,642,500 Operating income May April Unit data: Beginning inventory 50 525 Production 600 525 Sales 550 Variable costs: $ Manufacturing cost per unit produced 10,500 $ 10,500 Operating (marketing) cost per unit sold 3,800 3,800 Fixed costs: $ 2,250,000 $ 2,250,000 Manufacturing costs 675,000 Operating (marketing) costs 675,000 The selling price per vehicle is $23,000. The budgeted level of production used to calculate the budgeted fixed manufacturing cost per unit is 600 units. There are no price, efficiency, or spending variances. Any production-volume variance is written off to cost of goods sold in the month in which it occurs. April 2017 May 2017 $12,075,000 Revenues 12,650,000 Variable costs: Beginning inventory $ 525,000 0 6,300,000 5,512,500 Variable manufacturing costs Cost of goods available for sale 6,300,000 6,037,500 (525,000) (525,000) Less: Ending inventory Variable cost of goods sold 5,512,500 5,775,000 2,090,000 1,995,000 Variable operating costs 7,865,000 7,507,500 Total variable costs Contribution margin 4,785,000 4,567,500 Fixed costs: 2,250,000 2,250,000 Fixed manufacturing costs 675,000 675,000 Fixed operating costs 2,925,000 2,925,000 Total fixed costs $ 1,860,000 1,642,500 Operating income April 2017 May 2017 $12,650,000 12,075,000 Revenues Cost of goods sold: Beginning inventory 0 712,500 Variable manufacturing costs 6,300,000 5,512,500 2,250,000 1,968,750 Allocated fixed manufacturing costs Cost of goods available for sale 8,550,000 8,193,750 Less: Ending inventory (712,500) (712,500) 281,250 U 0 Adjustment for production-volume variance 7,837,500 7,762,500 Cost of goods sold Gross margin 4,812,500 4,312,500 Operating costs: Variable operating costs 2,090,000 1,995,000 675,000 675,000 Fixed operating costs 2,765,000 2,670,000 Total operating costs $ 2,047,500 $ 1,642,500 Operating incomeStep by Step Solution
There are 3 Steps involved in it
Step: 1

Get Instant Access to Expert-Tailored Solutions
See step-by-step solutions with expert insights and AI powered tools for academic success
Step: 2

Step: 3
Ace Your Homework with AI
Get the answers you need in no time with our AI-driven, step-by-step assistance
Get Started
Auditor Squad
Authors: IndigoPine Designs
1st Edition
B084Q9WM6S, 979-8609911131