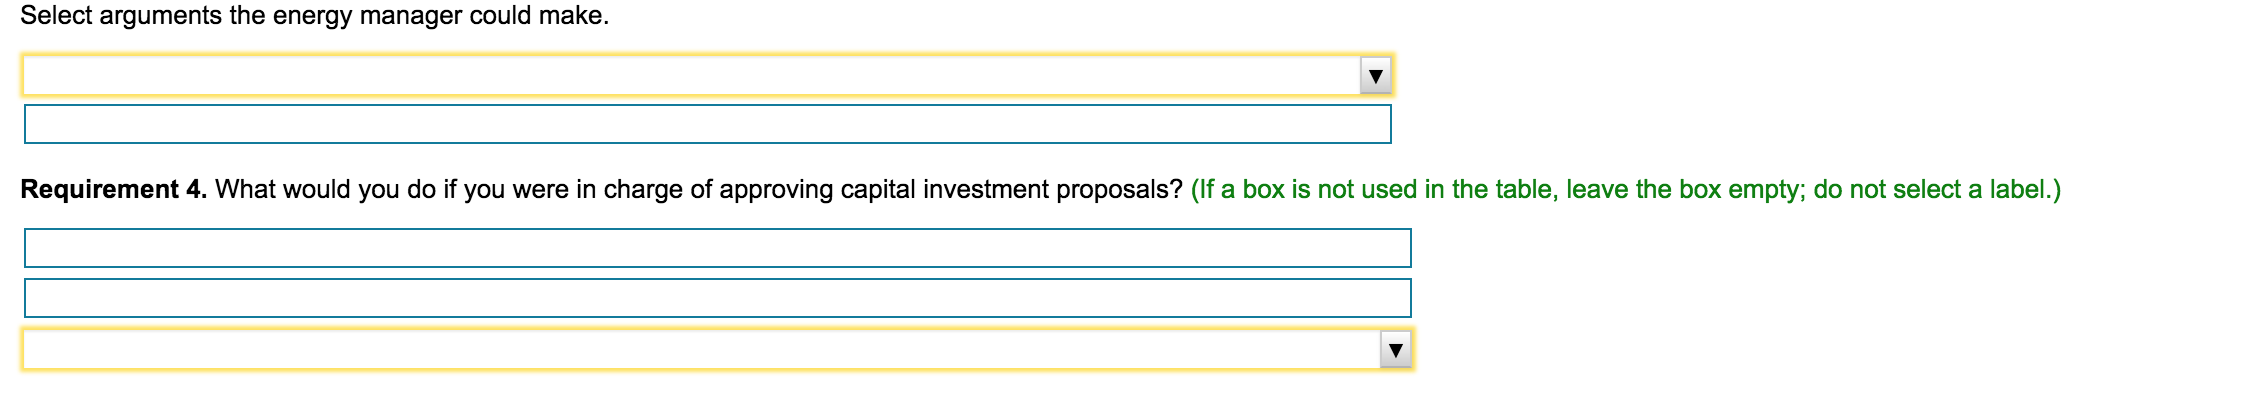
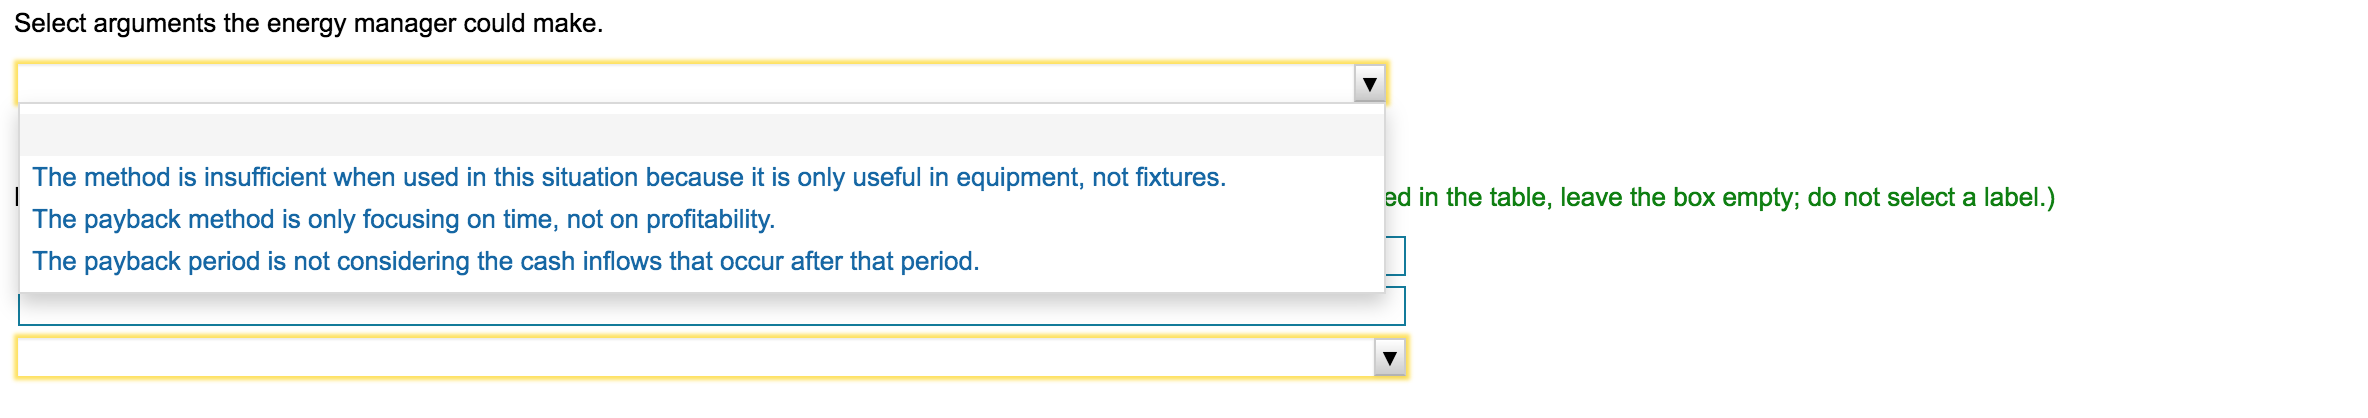
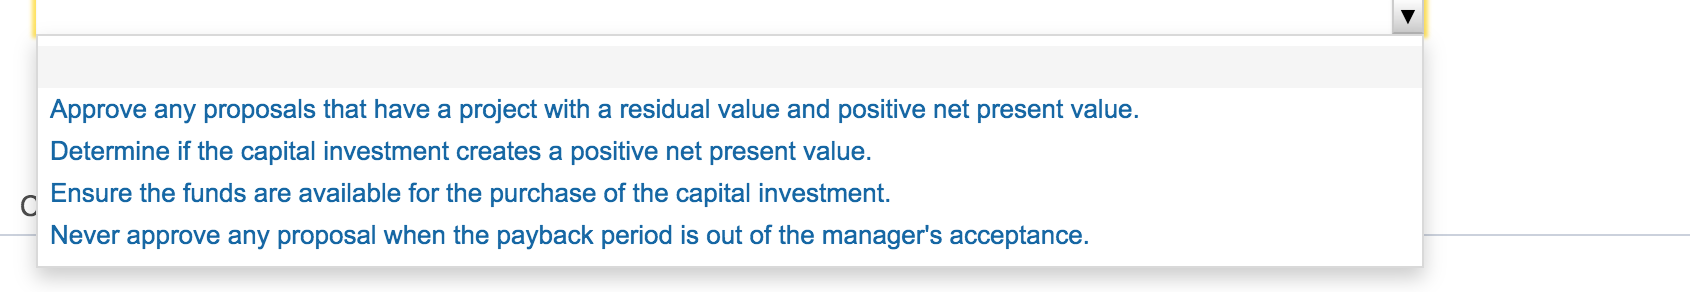
Requirement 3. If the company has a rule that no projects will be undertaken that have a payback period of more than five years, would this investment be accepted? If not, what arguments could the energy manager make to try to obtain approval for the solar panel project?
(no or yes) because the payback period is (more or less) than five years.
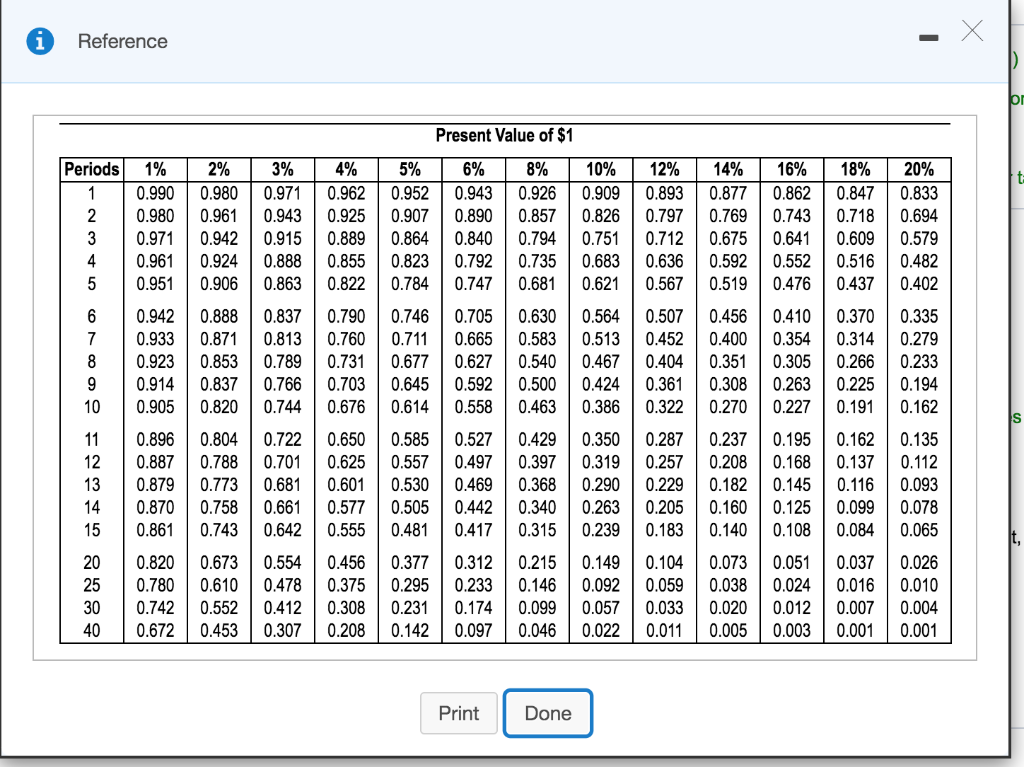
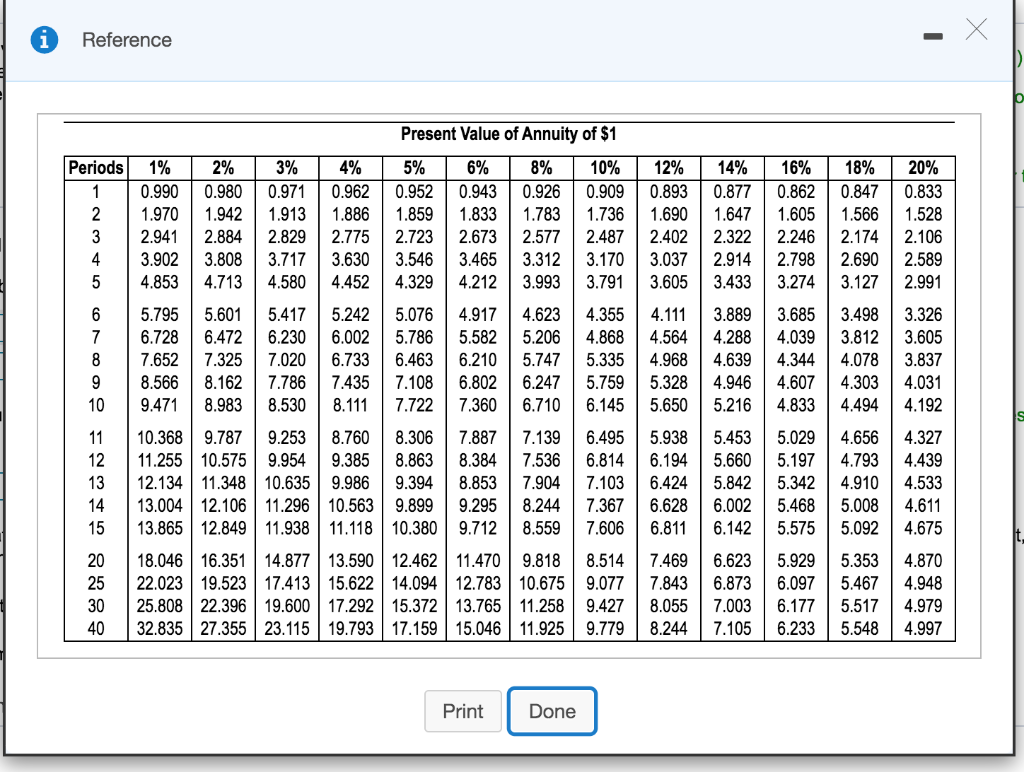
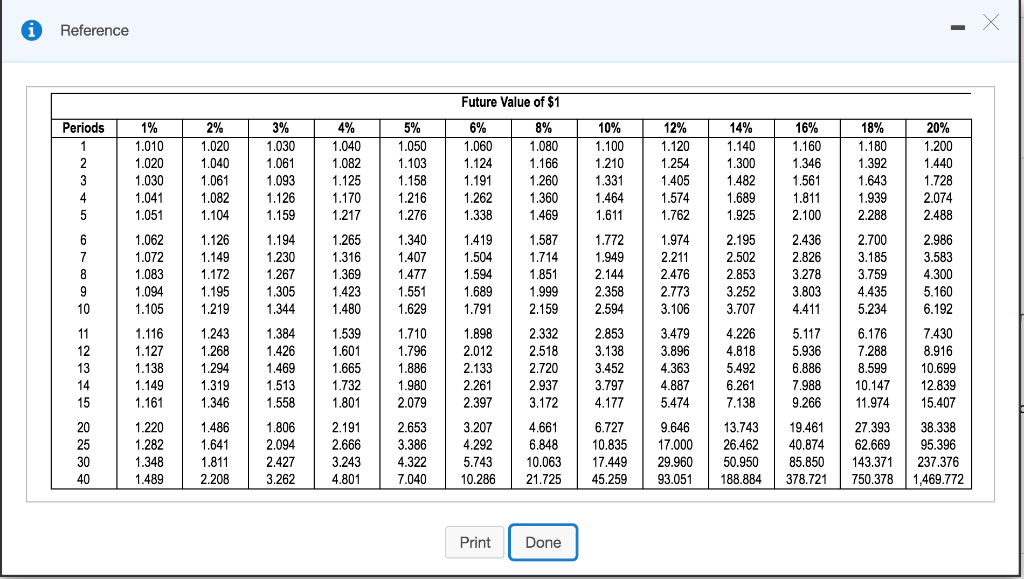
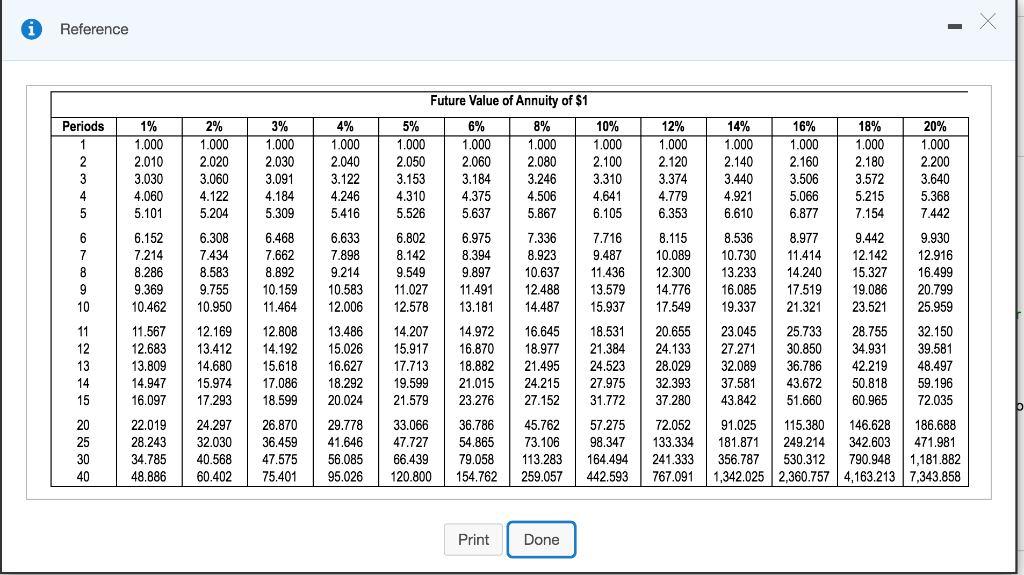
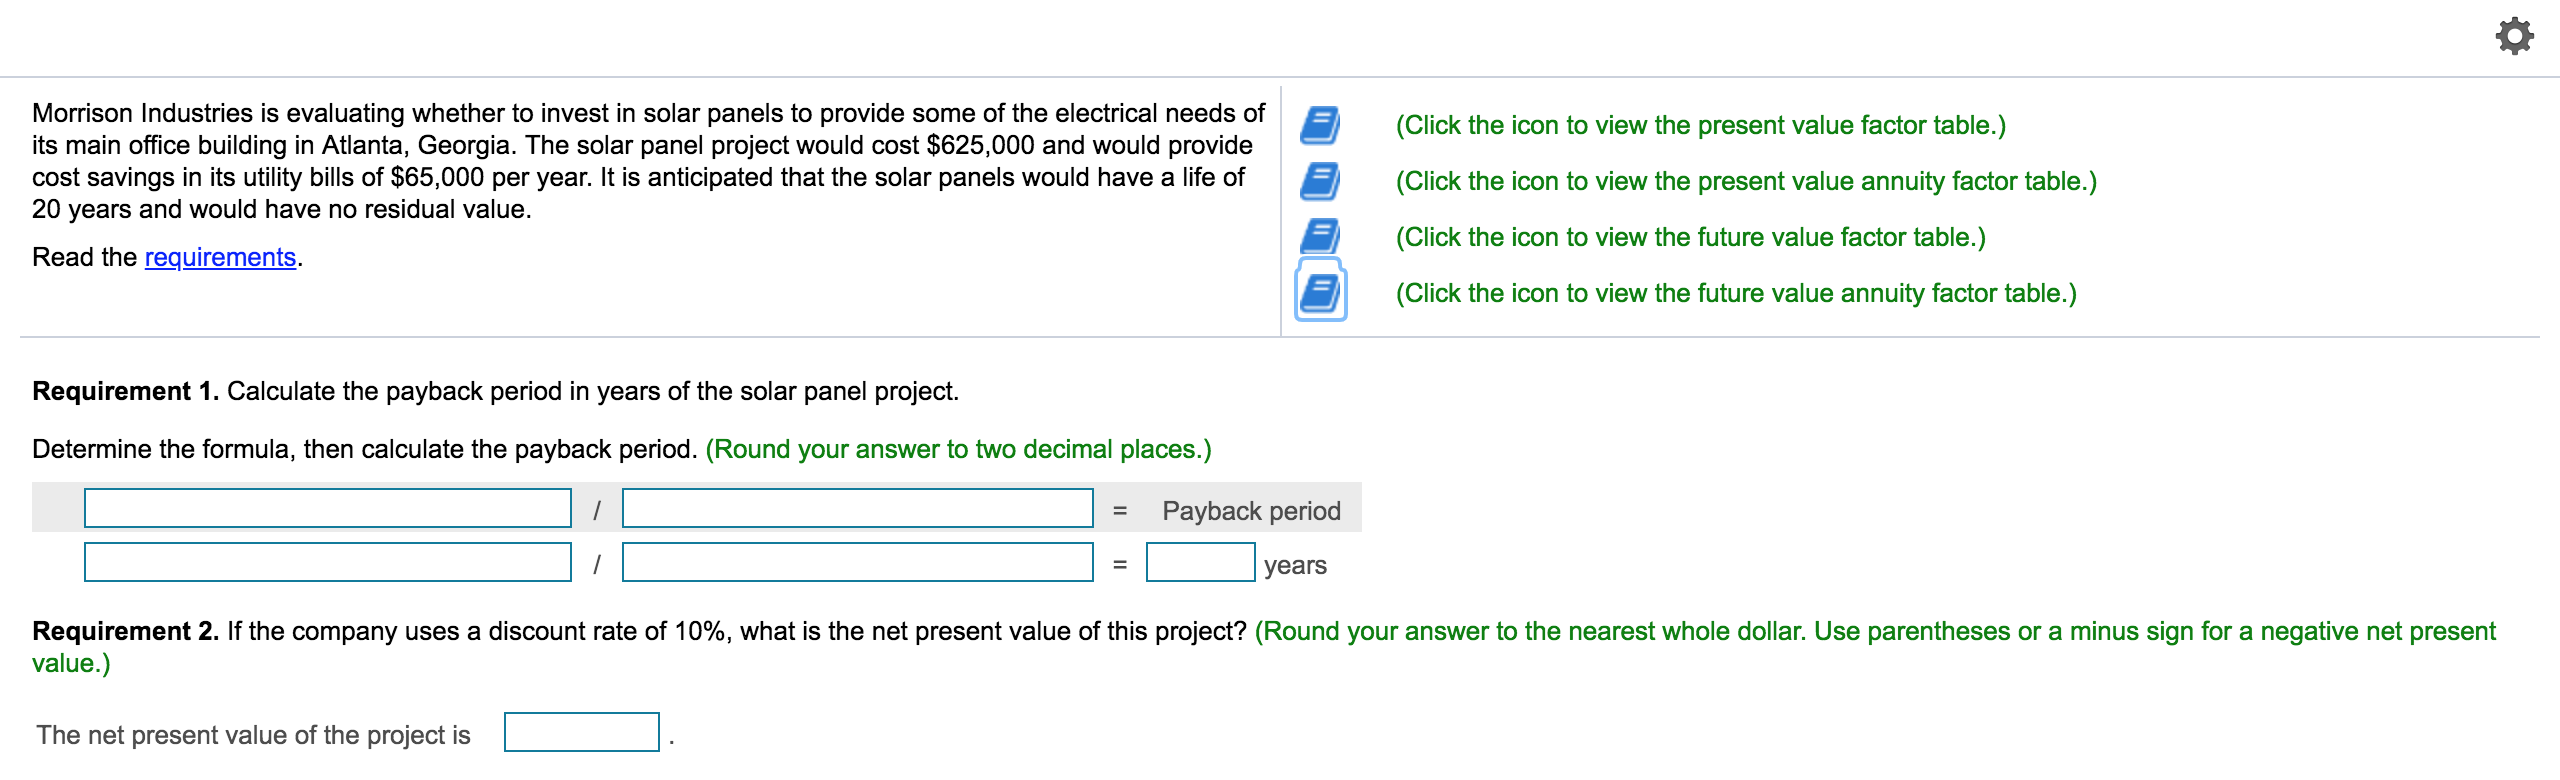
Reference Present Value of $1 Periods 1% 0.990 18% 0.847 1 0.980 2 3 4 5 0.718 2% 0.980 0.961 0.942 0.924 0.906 3% 0.971 0.943 0.915 0.888 0.863 4% 0.962 0.925 0.889 0.855 0.822 5% 0.952 0.907 0.864 0.823 0.784 6% 0.943 0.890 0.840 0.792 0.747 8% 0.926 0.857 0.794 0.735 0.681 10% 0.909 0.826 0.751 0.683 0.621 12% 0.893 0.797 0.712 0.636 0.567 14% 0.877 0.769 0.675 0.592 0.519 16% 0.862 0.743 0.641 0.552 0.476 20% 0.833 0.694 0.579 0.482 0.402 0.971 0.961 0.951 0.609 0.516 0.437 6 0.746 0.711 7 0.942 0.933 0.923 0.914 0.905 8 9 10 0.888 0.871 0.853 0.837 0.820 0.837 0.813 0.789 0.766 0.744 0.790 0.760 0.731 0.703 0.676 0.677 0.705 0.665 0.627 0.592 0.558 0.630 0.583 0.540 0.500 0.463 0.564 0.513 0.467 0.424 0.386 0.507 0.452 0.404 0.361 0.322 0.456 0.400 0.351 0.308 0.270 0.410 0.354 0.305 0.263 0.227 0.370 0.314 0.266 0.225 0.191 0.335 0.279 0.233 0.194 0.162 0.645 0.614 11 12 13 14 15 0.896 0.887 0.879 0.870 0.861 0.804 0.788 0.773 0.758 0.743 0.722 0.701 0.681 0.661 0.642 0.650 0.625 0.601 0.577 0.555 0.585 0.557 0.530 0.505 0.481 0.527 0.497 0.469 0.442 0.417 0.429 0.397 0.368 0.340 0.315 0.350 0.319 0.290 0.263 0.239 0.287 0.257 0.229 0.205 0.183 0.237 0.208 0.182 0.160 0.140 0.195 0.168 0.145 0.125 0.108 0.162 0.137 0.116 0.099 0.084 0.135 0.112 0.093 0.078 0.065 20 25 30 40 0.820 0.780 0.742 0.672 0.673 0.610 0.552 0.453 0.554 0.478 0.412 0.307 0.456 0.375 0.308 0.208 0.377 0.295 0.231 0.142 0.312 0.233 0.174 0.097 0.215 0.146 0.099 0.046 0.149 0.092 0.057 0.022 0.104 0.059 0.033 0.011 0.073 0.038 0.020 0.005 0.051 0.024 0.012 0.003 0.037 0.016 0.007 0.001 0.026 0.010 0.004 0.001 Print Done Reference Present Value of Annuity of $1 Periods 1 2 3 4 1% 0.990 1.970 2.941 3.902 4.853 2% 0.980 1.942 2.884 3.808 4.713 3% 0.971 1.913 2.829 3.717 4.580 4% 0.962 1.886 2.775 3.630 4.452 5% 0.952 1.859 2.723 3.546 4.329 6% 0.943 1.833 2.673 3.465 4.212 8% 0.926 1.783 2.577 3.312 3.993 10% 0.909 1.736 2.487 3.170 3.791 12% 0.893 1.690 2.402 3.037 3.605 14% 0.877 1.647 2.322 2.914 3.433 16% 0.862 1.605 2.246 2.798 3.274 18% 0.847 1.566 2.174 2.690 3.127 20% 0.833 1.528 2.106 2.589 2.991 01 + 8 9 10 5.795 6.728 7.652 8.566 9.471 5.601 6.472 7.325 8.162 8.983 5.417 6.230 7.020 7.786 8.530 5.242 6.002 6.733 7.435 8.111 5.076 5.786 6.463 7.108 7.722 4.917 5.582 6.210 6.802 7.360 4.623 5.206 5.747 6.247 6.710 4.355 4.868 5.335 5.759 6.145 4.111 4.564 4.968 5.328 5.650 3.889 4.288 4.639 4.946 5.216 3.685 4.039 4.344 4.607 4.833 3.498 3.812 4.078 4.303 4.494 3.326 3.605 3.837 4.031 4.192 11 12 13 14 15 10.368 9.787 9.253 8.760 8.306 11.255 10.575 9.954 9.385 8.863 12.134 11.348 10.635 9.986 9.394 13.004 12.106 11.296 10.563 9.899 13.865 12.849 11.938 11.118 10.380 7.887 8.384 8.853 9.295 9.712 7.139 7.536 7.904 8.244 8.559 6.495 6.814 7.103 7.367 7.606 5.938 6.194 6.424 6.628 6.811 5.453 5.660 5.842 6.002 6.142 5.029 5.197 5.342 5.468 5.575 4.656 4.793 4.910 5.008 5.092 4.327 4.439 4.533 4.611 4.675 20 25 30 40 18.046 16.351 14.877 13.590 12.462 11.470 9.818 22.023 19.523 17.41315.622 14.094 12.783 10.675 25.808 22.396 19.600 17.292 15.372 13.765 11.258 32.835 27.355 23.115 19.793 17.159 15.046 11.925 8.514 9.077 9.427 9.779 7.469 7.843 8.055 8.244 6.623 6.873 7.003 7.105 5.929 6.097 6.177 6.233 5.353 5.467 5.517 5.548 4.870 4.948 4.979 4.997 Print Done 0 Reference Future Value of $1 Periods 1 2 3 4 1% 1.010 1.020 1.030 1.041 1.051 2% 1.020 1.040 1.061 1.082 1.104 3% 1.030 1.061 1.093 1.126 1.159 4% 1.040 1.082 1.125 1.170 1.217 5% 1.050 1.103 1.158 1.216 1.276 6% 1.060 1.124 1.191 1.262 1.338 8% 1.080 1.166 1.260 1.360 1.469 10% 1.100 1.210 1.331 1.464 1.611 12% 1.120 1.254 1.405 1.574 1.762 14% 1.140 1.300 1.482 1.689 1.925 16% 1.160 1.346 1.561 1.811 2.100 18% 1.180 1.392 1.643 1.939 2.288 20% 1.200 1.440 1.728 2.074 2.488 6 7 8 9 10 1.062 1.072 1.083 1.094 1.105 1.126 1.149 1.172 1.195 1.219 1.340 1.407 1.477 1.551 1.629 1.587 1.714 1.851 1.999 2.159 1.772 1.949 2.144 2.358 2.594 1.974 2.211 2.476 2.773 3.106 2.195 2.502 2.853 3.252 3.707 2.436 2.826 3.278 3.803 4.411 2.700 3.185 3.759 4.435 5.234 2.986 3.583 4.300 5.160 6.192 1.194 1.230 1.267 1.305 1.344 1.384 1.426 1.469 1.513 1.558 1.265 1.316 1.369 1.423 1.480 1.539 1.601 1.665 1.732 1.801 1.419 1.504 1.594 1.689 1.791 1.898 2.012 2.133 2.261 2.397 7.430 11 12 13 14 15 1.116 1.127 1.138 1.149 1.161 1.243 1.268 1.294 1.319 1.346 1.710 1.796 1.886 1.980 2.079 2.332 2.518 2.720 2.937 3.172 2.853 3.138 3.452 3.797 4.177 3.479 3.896 4.363 4.887 5.474 4.226 4.818 5.492 6.261 7.138 5.117 5.936 6.886 7.988 9.266 6.176 7.288 8.599 10.147 11.974 8.916 10.699 12.839 15.407 20 25 30 40 1.220 1.282 1.348 1.489 1.486 1.641 1.811 2.208 1.806 2.094 2.427 3.262 2.191 2.666 3.243 4.801 2.653 3.386 4.322 7.040 3.207 4.292 5.743 10.286 4.661 6.848 10.063 21.725 6.727 10.835 17.449 45.259 9.646 17.000 29.960 93.051 13.743 26.462 50.950 188.884 19.461 40.874 85.850 378.721 27.393 62.669 143.371 750.378 38.338 95.396 237.376 1,469.772 Print Done Reference Periods 1 2 3 1% 1.000 2.010 3.030 4.060 5.101 2% 1.000 2.020 3.060 4.122 5.204 3% 1.000 2.030 3.091 4.184 5.309 4 5 4% 1.000 2.040 3.122 4.246 5.416 6.633 7.898 9.214 10.583 12.006 12% 1.000 2.120 3.374 4.779 6.353 8.115 10.089 12.300 14.776 17.549 6 7 8 9 10 6.152 7.214 8.286 9.369 10.462 6.308 7.434 8.583 9.755 10.950 Future Value of Annuity of $1 5% 6% 8% 10% 1.000 1.000 1.000 1.000 2.050 2.060 2.080 2.100 3.153 3.184 3.246 3.310 4.310 4.375 4.506 4.641 5.526 5.637 5.867 6.105 6.802 6.975 7.336 7.716 8.142 8.394 8.923 9.487 9.549 9.897 10.637 11.436 11.027 11.491 12.488 13.579 12.578 13.181 14.487 15.937 14.207 14.972 16.645 18.531 15.917 16.870 18.977 21.384 17.713 18.882 21.495 24.523 19.599 21.015 24.215 27.975 21.579 23.276 27.152 31.772 33.066 36.786 45.762 57.275 47.727 54.865 73.106 98.347 66.439 79.058 113.283 164.494 120.800 154.762 259.057 442.593 6.468 7.662 8.892 10.159 11.464 12.808 14.192 15.618 17.086 18.599 14% 16% 18% 20% 1.000 1.000 1.000 1.000 2.140 2.160 2.180 2.200 3.440 3.506 3.572 3.640 4.921 5.066 5.215 5.368 6.610 6.877 7.154 7.442 8.536 8.977 9.442 9.930 10.730 11.414 12.142 12.916 13.233 14.240 15.327 16.499 16.085 17.519 19.086 20.799 19.337 21.321 23.521 25.959 23.045 25.733 28.755 32.150 27.271 30.850 34.931 39.581 32.089 36.786 42.219 48.497 37.581 43.672 50.818 59.196 43.842 51.660 60.965 72.035 91.025 115.380 146.628 186.688 181.871 249.214 342.603 471.981 356.787 530.312 790.948 1,181.882 1,342.025 2,360.757 4,163.213 7,343.858 11 12 13 14 15 11.567 12.683 13.809 14.947 16.097 12.169 13.412 14.680 15.974 17.293 13.486 15.026 16.627 18.292 20.024 20.655 24.133 28.029 32.393 37.280 20 25 30 40 22.019 28.243 34.785 48.886 24.297 32.030 40.568 60.402 26.870 36.459 47.575 75.401 29.778 41.646 56.085 95.026 72.052 133.334 241.333 767.091 Print Done (Click the icon to view the present value factor table.) Morrison Industries is evaluating whether to invest in solar panels to provide some of the electrical needs of its main office building in Atlanta, Georgia. The solar panel project would cost $625,000 and would provide cost savings in its utility bills of $65,000 per year. It is anticipated that the solar panels would have a life of 20 years and would have no residual value. (Click the icon to view the present value annuity factor table.) (Click the icon to view the future value factor table.) Read the requirements. (Click the icon to view the future value annuity factor table.) Requirement 1. Calculate the payback period in years of the solar panel project. Determine the formula, then calculate the payback period. (Round your answer to two decimal places.) Payback period years Requirement 2. If the company uses a discount rate of 10%, what is the net present value of this project? (Round your answer to the nearest whole dollar. Use parentheses or a minus sign for a negative net present value.) The net present value of the project is Select arguments the energy manager could make. Requirement 4. What would you do if you were in charge of approving capital investment proposals? (If a box is not used in the table, leave the box empty; do not select a label.) Select arguments the energy manager could make. ed in the table, leave the box empty; do not select a label.) The method is insufficient when used in this situation because it is only useful in equipment, not fixtures. The payback method is only focusing on time, not on profitability. The payback period is not considering the cash inflows that occur after that period. Approve any proposals that have a project with a residual value and positive net present value. Determine if the capital investment creates a positive net present value. Ensure the funds are available for the purchase of the capital investment. Never approve any proposal when the payback period is out of the manager's acceptance