Requirement:
Choose a company from Muscat Securities Market and prepare a financial statement analysis for the company. The analysis must include the calculation of the following ratios for threeyears and short comments on the ratios. Some companies published their reports for 2020, some others are expected to announce in March. Therefore, if the chosen company published for 2018. OR
please go to please
Requirement:
Choose a company from Muscat Securities Market and prepare a financial statement analysis for the company. The analysis must include the calculation of the following ratios for threeyears and short comments on the ratios. Some companies published their reports for 2020, some others are expected to announce in March. Therefore, if the chosen company published for 2020, use 2020,2019,and 2018. OR alternatively you can use 2019,2018 and 2017.
please quickly please quickly I don't have any time
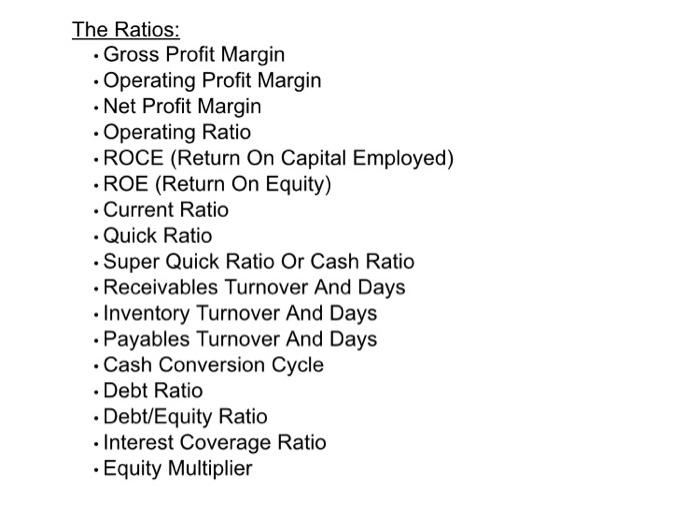
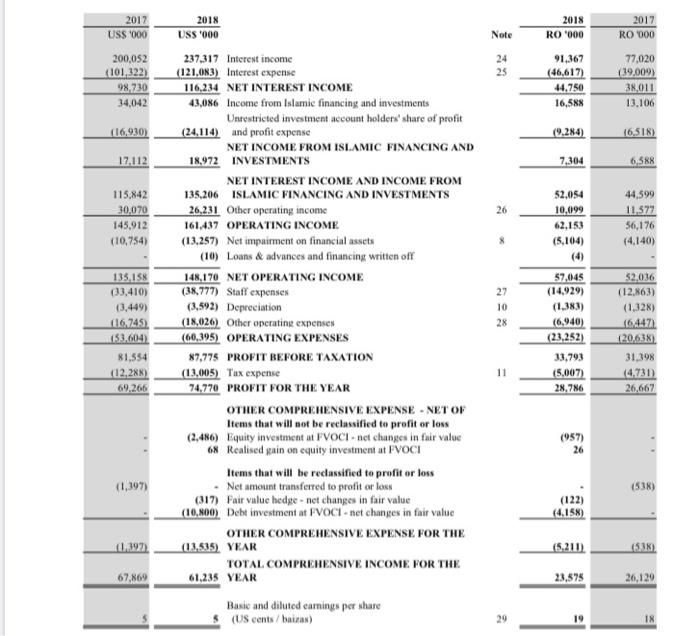
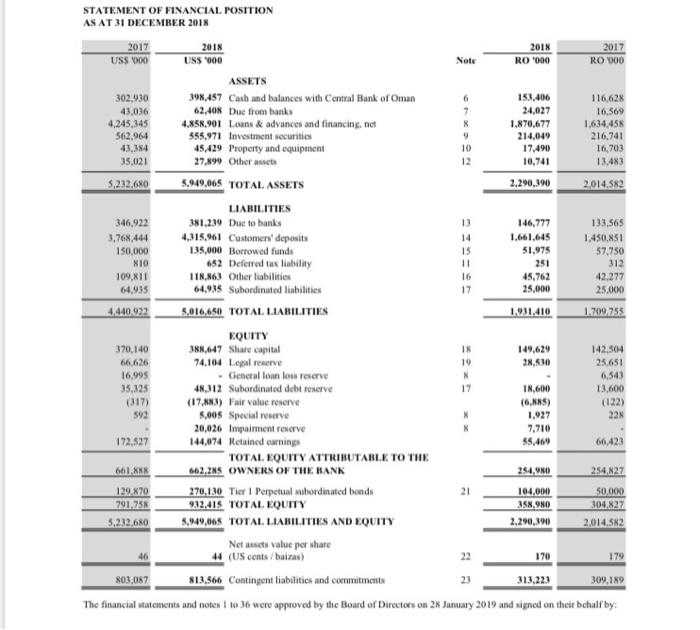
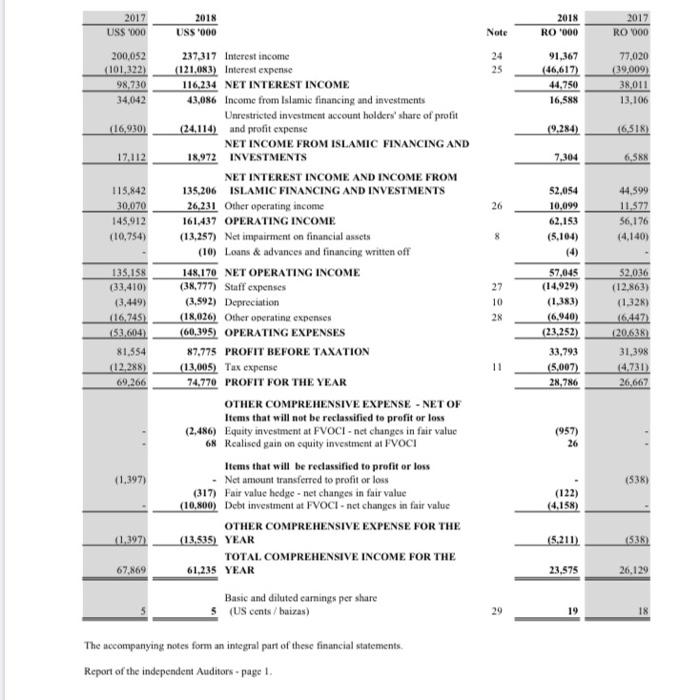
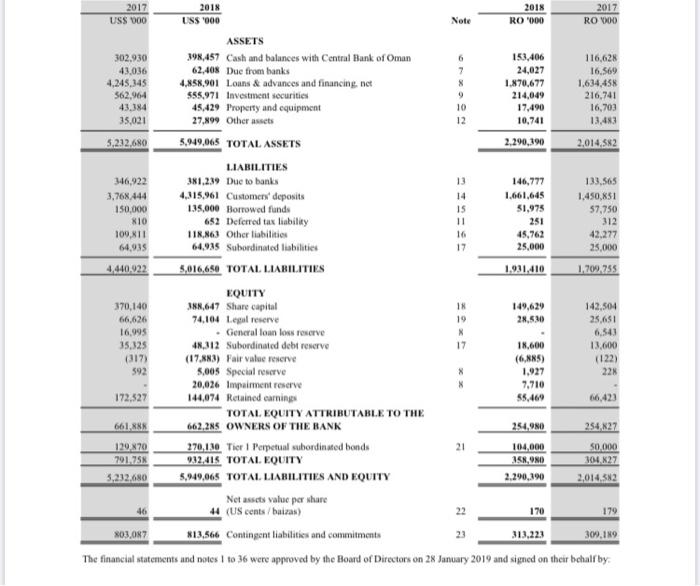
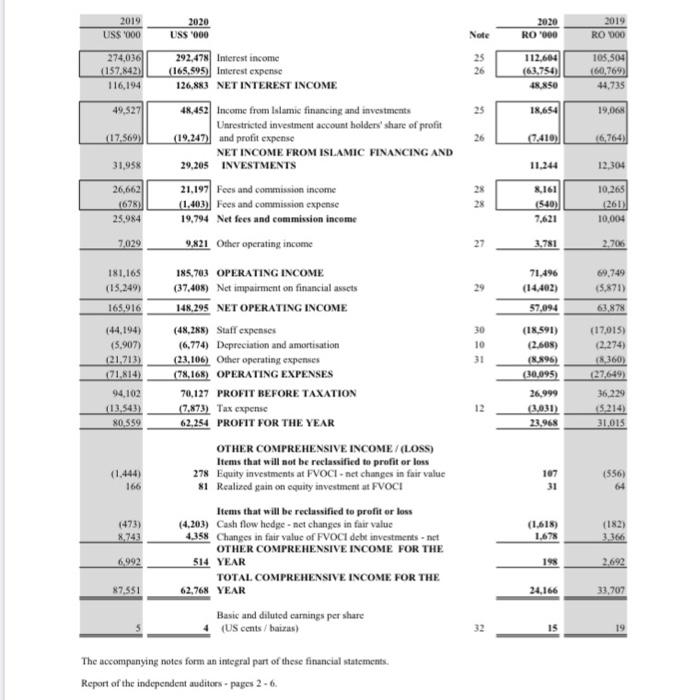
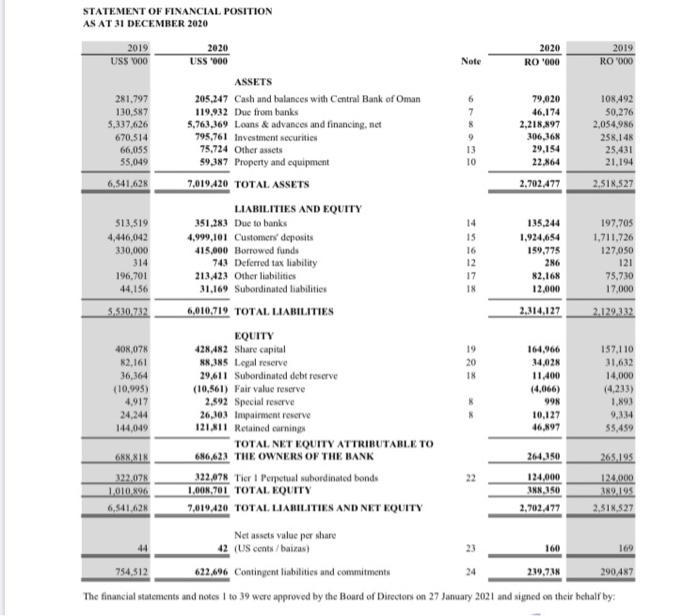
The Ratios: Gross Profit Margin Operating Profit Margin Net Profit Margin Operating Ratio ROCE (Return On Capital Employed) . ROE (Return On Equity) Current Ratio Quick Ratio Super Quick Ratio Or Cash Ratio Receivables Turnover And Days Inventory Turnover And Days Payables Turnover And Days Cash Conversion Cycle Debt Ratio Debt/Equity Ratio Interest Coverage Ratio Equity Multiplier 2018 R0 000 Note 2017 USS 000 200,052 (101,322) 98,730 34,042 24 25 91.367 (46,617) 44,750 16,588 2017 RO 20 77,020 (39.009) 38,011 13,106 16,518) (16,930) 17,112 (9.284) 7,304 6,388 26 115,842 30,070 145,912 (10,754) $2.054 10,099 62.153 (5,104) (4) 44,599 11,572 56,176 (4.140) 2018 USS OGO 237,317 Interest income (121,083) Interest expense 116,234 NET INTEREST INCOME 43,086 Income from Islamic financing and investments Unrestricted investment account holders' share of profit (24,114) and profit expense NET INCOME FROM ISLAMIC FINANCING AND 18,972 INVESTMENTS NET INTEREST INCOME AND INCOME FROM 135.206 ISLAMIC FINANCING AND INVESTMENTS 26,231 Other operating income 161,437 OPERATING INCOME (13.257) Net impairment on financial assets (10) Loans & advances and financing written off 148,170 NET OPERATING INCOME (38,777) Staff expenses (3,592) Depreciation (18,020) Other operating expenses (60,395) OPERATING EXPENSES 87,775 PROFIT BEFORE TAXATION (13,005) Tax expense 74,770 PROFIT FOR THE YEAR OTHER COMPREHENSIVE EXPENSE - NET OF Items that will not be reclassified to profit or loss (2,486) Equity investment at FVOCI - net changes in fair value 68 Realised gain on equity investment at FVOCI Items that will be reclassified to profit or loss . Net amount transferred to profit or loss (317) Fair value hede - net changes in fair value (10,800) Debt investment at FVOCI - net changes in fair value OTHER COMPREHENSIVE EXPENSE FOR THE (13.535). YEAR TOTAL COMPREHENSIVE INCOME FOR THE 61,235 YEAR 135,158 (33,410) (3,449) (16.745) 153.604) 81,554 (12,288) 69.266 27 10 28 57,045 (14,929) (1,383) (6,940) (23,252) 33,793 (5.007) 28,786 52,036 (12,863) (1.328) (6 447) (20638) 31,398 (4,731 26,667 11 (957) (1,397) (538) (122) (4.158) (1,397) (5.211) (5.38) 67,869 23,575 26,129 Basic and diluted earnings per share $ US cons/baizas) 29 19 18 6 x 9 13 14 11 STATEMENT OF FINANCIAL POSITION AS AT 31 DECEMBER 2018 2017 2018 2018 2017 USS 000 USS 000 Note R0 40 RO 900 ASSETS 302,930 398.457 Cash and balances with Central Bank of Oman 153,406 116,628 43,036 62,408 Due from banks 7 24,027 16.569 4,245,345 4,858.901 Loans & advances and financing.net 1.870,677 1,634,455 562.964 555,971 Investment securities 214,049 216,741 43,384 45,429 Property and equipment 10 17.490 16,703 35,021 27.899 Other assets 12 10,741 5,222.680 5.949.065 TOTAL ASSETS 2.290,390 2014.562 LIABILITIES 346,922 381.239 Due to banks 146,777 133,565 3,768,444 4,315,961 Customers' deposits 1.661,645 1.450,851 150,000 135,000 Borrowed funds 15 51.975 57,750 MIO 652 Deferred tax liability 251 312 109,811 118.863 Other liabilities 45,762 42.277 64,935 64,935 Subordinated liabilities 17 25.000 25.000 4,440.022 5,016650 TOTAL LIABILITIES 1,931,410 1.700.755 EQUITY 370.140 388.647 Share capital IN 149.629 142,504 66.626 74.104 Lopal reserve 19 23,530 25,651 16,995 General loan los reserve 6,543 35,125 48.312 Subordinated debt reserve 18,600 13,600 (317) (17,883) Fair value reserve (6,85) (122) 592 8,005 Special reserve 1.927 225 20,026 Impaiment reserve 7,710 172.527 144,074 Retained earning 59.469 66,423 TOTAL EQUITY ATTRIBUTABLE TO THE CH 1,8m 662,285 OWNERS OF THE BANK 254,90 2:54,627 129,870 270,130 Tier I Perpetual subordinated bonds 21 104.000 50,000 791,758 932,415 TOTAL EQUITY 358,90 304.827 5,233.680 5.949.065 TOTAL LIABILITIES AND EQUITY 2.290,390 2,014,562 Net assets value per share 46 44 (US cents / bazas 22 170 179 803,087 813,566 Contingent liabilities and commitments 23 313,223 309.189 The financial statements and notes 1 to 36 were approved by the Board of Directors on 28 January 2019 and signed on their bchall by: X 17 The Ratios: . Gross Profit Margin Operating Profit Margin Net Profit Margin Operating Ratio ROCE (Return On Capital Employed) ROE (Return On Equity) . Current Ratio Quick Ratio Super Quick Ratio Or Cash Ratio Receivables Turnover And Days Inventory Turnover And Days Payables Turnover And Days - Cash Conversion Cycle Debt Ratio Debt/Equity Ratio Interest Coverage Ratio Equity Multiplier 2017 USS 000 Note 2018 RO 9001 24 25 200,052 (101322) 98.730 34,042 91,367 (46,617) 44,750 16,588 2017 RO 900 77,020 (39,009) 38.011 13,106 (16,930) (9,284) 16518) 17.112 7,304 6,588 26 115,842 30.070 145,912 (10,754) 52,054 10.099 62,153 (5.104) (4) 44,599 11,572 56,176 (4,140) 2018 USS '000 237,317 Interest income (121.083) Interest expense 116,234 NET INTEREST INCOME 43,086 Income from Islamic financing and investments Unrestricted investment account holders' state of protit (24,114) and profit expense NET INCOME FROM ISLAMIC FINANCING AND 18,972 INVESTMENTS NET INTEREST INCOME AND INCOME FROM 135,206 ISLAMIC FINANCING AND INVESTMENTS 26,231 Other operating income 161,437 OPERATING INCOME (13,257) Net impairment on financial assets (10) Loans & advances and financing written off 148,170 NET OPERATING INCOME (38,777) Staff expenses (3,592) Depreciation (18.026) Other operating expenses (60,395) OPERATING EXPENSES 87,775 PROFIT BEFORE TAXATION (13,005) Tax expense 74,770 PROFIT FOR THE YEAR OTHER COMPREHENSIVE EXPENSE - NET OF Items that will not be reclassified to profit or loss (2,486) Equity investment at FVOCI - net changes in fair value 68 Realised gain on cquity investment at FVOCI Items that will be reclassified to profit or loss Net amount transferred to profit or loss (317) Fair value hedge - net changes in fair value (10.800) Debt investment at FVOCI - nct changes in fair value OTHER COMPREHENSIVE EXPENSE FOR THE (13,535) YEAR TOTAL COMPREHENSIVE INCOME FOR THE 61,235 YEAR Basic and diluted carnings per share (US cents / baixas) 135,158 (33,410) (3,449) (16.745) (53.604) 81,554 (12,288) 69.266 27 10 2x 57,045 (14,929) (1.383) (6,940) (23.252) 52,036 (12,863) (1,328) (6447) (20.638) 31,398 14.731) 26,667 33,793 (5,007) 28,786 (957) 26 (1.397) (538) (122) (4,158) (1,397) (5,211) (538) 67,869 23,575 26,129 29 19 18 The accompanying notes form an integral part of these financial statement Report of the independent Auditors - page 1 2017 USS 000 2018 USS '000 2018 R0 (100 2017 RO 2012 Note 6 7 ASSETS 302.930 398.457 Cash and balances with Central Bank of Oman 153.406 116,628 43,036 62.408 Due from banks 24,027 16.569 4,245,345 4.858.901 Loans & advances and financing. net 1.870,677 1,634,458 562,964 555,971 Investment securities 9 214,049 216,741 43,384 45.429 Property and equipment 10 17,490 16,703 35,021 27.899 Other assets 12 10,741 13,453 5,222.680 5,949,065 TOTAL ASSETS 2,290,390 2.014582 LIABILITIES 346,922 381,239 Due to banks 13 146,777 133,565 3,768 444 4,315,961 Customers' deposits 14 1.661,645 1,450,851 150,000 135.000 Borrowed funds 15 51,975 57,750 810 652 Deferred tax liability 11 251 312 109,811 118.863 Other liabilities 16 45,762 42,277 64,935 64.925 Subordinated liabilities 17 25.000 25,000 4,440.922 5,016,650 TOTAL LIABILITIES 1.931,410 1,700.755 EQUITY 370,140 388,647 Share capital IN 149,629 142,504 66.626 74,104 Legal reserve 19 28.8.10 25.631 16,995 General loan los reserve N 6.541 35,325 48,312 Subordinated debt reserve 17 18,600 13.600 017) (17.883) Fair value reserve (6.885) (122) 592 5,005 Special reserve X 1.927 228 20,026 Impairment reserve 7,710 172,527 144,074 Retained carning 55.469 66,423 TOTAL EQUITY ATTRIBUTABLE TO THE 661,88 662,285 OWNERS OF THE BANK 254,9NO 254.27 120x70 170,130 Tier I Perpetual subordinated bonds 21 104,000 50.000 791.758 932,415. TOTAL EQUITY 358,980 304,627 3,232.680 5,949,065 TOTAL LIABILITIES AND EQUITY 2.290,390 2.014.312 Net assets value por share 44 (US cons/baras) 170 179 803.087 $13,566 Contingent liabilities and commitments 23 313,223 309.189 The financial statements and notes I to 36 were approved by the Board of Directors on 28 January 2019 and signed on their bchall by 2019 USS '000 2020 USS 000 2020 60 "Won 2019 RO DOO Note 274,036) (157 8421 116,194 25 26 112.604 (63,754) 48.850 103,504 60,769 44,735 49,527 25 18,654 19,068 (17.569) 26 7.410) (6,764 31,958 11.244 12,304 26,662 (678) 25,984 28 28 8.161 (540) 7.621 10,265 (261) 10,004 7,029 27 3.781 2.706 71.496 (14.402) 57,094 181,165 (15,249) 165.916 (44,194) (5,907) (21.713) 171.814) 94.102 (13,543) 80,559 292.473 Interest income (165.595) Interest expense 126,883 NET INTEREST INCOME 48,452 Income from Islame financing and investments Unrestricted investment account holders' share of profit (19.247) and profit expense NET INCOME FROM ISLAMIC FINANCING AND 29,205 INVESTMENTS 21,197 Fees and commission income (1,403) Fees and commission expense 19,794 Net fees and commission income 9,821 Other operating income 185,703 OPERATING INCOME (37,408) Nct impairment on financial assets 148.295 NET OPERATING INCOME (48.288) Staff expenses (6,774) Depreciation and amortisation (23,106) Other operating expenses (78,168) OPERATING EXPENSES 70,127 PROFIT BEFORE TAXATION (7,873) Tax expense 62,254 PROFIT FOR THE YEAR OTHER COMPREHENSIVE INCOME /(LOSS) Items that will not be reclassified to profit or loss 278 Equity investments at FVOCI.net changes in fair value *1 Realized gain on equity investment at FVOCI Items that will be reclassified to profit or less (4.203) Cash flow hedge - net changes in fair value 4,358 Changes in fair value of FVOCI debt investments - net OTHER COMPREHENSIVE INCOME FOR THE 514 YEAR TOTAL COMPREHENSIVE INCOME FOR THE 62,768 YEAR 30 10 31 (18.591) (2.605) (8896) (30.095) 26,999 (3.031) 23,968 69,749 15871 63,878 (17015) (2,274) 18,360) (27,649) 36.229 (5,214) 31,015 12 107 31 (556) 64 166 (473) 8,743 (1.618) 1.678 (182) 3.366 2.692 6,992 198 87.551 24,166 33,707 Basic and diluted camnings per share (US cents / baras) 15 The accompanying notes form an integral part of these financial statements. Report of the independent auditors - pages 2-6, Note 6 7 9 STATEMENT OF FINANCIAL POSITION AS AT 31 DECEMBER 2020 2019 2020 2020 2019 USS 000 USS 000 RO 100 RO (MM) ASSETS 281,797 205,247 Cash and balances with Central Bank of Oman 79,020 108.492 130,587 119.932 Due from banks 46,174 50.276 5,337,6.26 5,763,369 Loans & advances and financing, net * 2.218,897 2,054,986 670.514 795,761 Investment securities 306,368 258.148 66,055 75,724 Other assets 13 29,154 25.431 35,049 59.387 Property and equipment 10 22.864 21,194 6,541.628 17.019,420 TOTAL ASSETS 2.702,477 2.51K.527 LIABILITIES AND EQUITY 513,519 351.283 Due to banks 14 135.244 197.705 4,446,042 4,999,101 Customers' deposits IS 1.924,654 1,711,726 330,000 415,000 Borrowed funds 16 159,775 127,050 314 743 Deferred tax liability 12 286 121 196,701 213.423 Other liabilities 17 82.168 75.730 44,156 31.169 Subordinated liabilities IN 12,000 17.000 3,530,732 6,010,719 TOTAL LIABILITIES 2,314,127 2.129.332 EQUITY 408,078 428,482 Share capital 164,966 159.110 82,161 $8.385 Legal reserve 20 34,028 31,632 36,364 29,611 Subordinated debt reserve 11.400 14,000 (10,995) (10,561) Fair value reserve (4.066) (4.233) 4,917 2.592 Special reserve 998 24,244 26,303 Impairment reserve 10,127 9,114 144,049 121.311 Retained camning 46,897 55,459 TOTAL NET EQUITY ATTRIBUTABLE TO 688818 686,623 THE OWNERS OF THE BANK 264.350 265.195 122.07% 322,078 Tier I Perpetual subordinated bonds 124.000 124.000 1010.896 1,005,701 TOTAL EQUITY INN.JSO 389.195 6,541.62% 7,019,420 TOTAL LIABILITIES AND NET EQUITY 2.702.477 2.514.527 Net assets value per share 42 (US cents / baixas 23 160 169 754,512 622.696 Contingent liabilities and commitment 219,71 290,487 The financial statements and notes 1 to 39 were approved by the Board of Directory on 27 January 2021 and signed on their behalf by: 19 IN 1.893 22 24 The Ratios: Gross Profit Margin Operating Profit Margin Net Profit Margin Operating Ratio ROCE (Return On Capital Employed) . ROE (Return On Equity) Current Ratio Quick Ratio Super Quick Ratio Or Cash Ratio Receivables Turnover And Days Inventory Turnover And Days Payables Turnover And Days Cash Conversion Cycle Debt Ratio Debt/Equity Ratio Interest Coverage Ratio Equity Multiplier 2018 R0 000 Note 2017 USS 000 200,052 (101,322) 98,730 34,042 24 25 91.367 (46,617) 44,750 16,588 2017 RO 20 77,020 (39.009) 38,011 13,106 16,518) (16,930) 17,112 (9.284) 7,304 6,388 26 115,842 30,070 145,912 (10,754) $2.054 10,099 62.153 (5,104) (4) 44,599 11,572 56,176 (4.140) 2018 USS OGO 237,317 Interest income (121,083) Interest expense 116,234 NET INTEREST INCOME 43,086 Income from Islamic financing and investments Unrestricted investment account holders' share of profit (24,114) and profit expense NET INCOME FROM ISLAMIC FINANCING AND 18,972 INVESTMENTS NET INTEREST INCOME AND INCOME FROM 135.206 ISLAMIC FINANCING AND INVESTMENTS 26,231 Other operating income 161,437 OPERATING INCOME (13.257) Net impairment on financial assets (10) Loans & advances and financing written off 148,170 NET OPERATING INCOME (38,777) Staff expenses (3,592) Depreciation (18,020) Other operating expenses (60,395) OPERATING EXPENSES 87,775 PROFIT BEFORE TAXATION (13,005) Tax expense 74,770 PROFIT FOR THE YEAR OTHER COMPREHENSIVE EXPENSE - NET OF Items that will not be reclassified to profit or loss (2,486) Equity investment at FVOCI - net changes in fair value 68 Realised gain on equity investment at FVOCI Items that will be reclassified to profit or loss . Net amount transferred to profit or loss (317) Fair value hede - net changes in fair value (10,800) Debt investment at FVOCI - net changes in fair value OTHER COMPREHENSIVE EXPENSE FOR THE (13.535). YEAR TOTAL COMPREHENSIVE INCOME FOR THE 61,235 YEAR 135,158 (33,410) (3,449) (16.745) 153.604) 81,554 (12,288) 69.266 27 10 28 57,045 (14,929) (1,383) (6,940) (23,252) 33,793 (5.007) 28,786 52,036 (12,863) (1.328) (6 447) (20638) 31,398 (4,731 26,667 11 (957) (1,397) (538) (122) (4.158) (1,397) (5.211) (5.38) 67,869 23,575 26,129 Basic and diluted earnings per share $ US cons/baizas) 29 19 18 6 x 9 13 14 11 STATEMENT OF FINANCIAL POSITION AS AT 31 DECEMBER 2018 2017 2018 2018 2017 USS 000 USS 000 Note R0 40 RO 900 ASSETS 302,930 398.457 Cash and balances with Central Bank of Oman 153,406 116,628 43,036 62,408 Due from banks 7 24,027 16.569 4,245,345 4,858.901 Loans & advances and financing.net 1.870,677 1,634,455 562.964 555,971 Investment securities 214,049 216,741 43,384 45,429 Property and equipment 10 17.490 16,703 35,021 27.899 Other assets 12 10,741 5,222.680 5.949.065 TOTAL ASSETS 2.290,390 2014.562 LIABILITIES 346,922 381.239 Due to banks 146,777 133,565 3,768,444 4,315,961 Customers' deposits 1.661,645 1.450,851 150,000 135,000 Borrowed funds 15 51.975 57,750 MIO 652 Deferred tax liability 251 312 109,811 118.863 Other liabilities 45,762 42.277 64,935 64,935 Subordinated liabilities 17 25.000 25.000 4,440.022 5,016650 TOTAL LIABILITIES 1,931,410 1.700.755 EQUITY 370.140 388.647 Share capital IN 149.629 142,504 66.626 74.104 Lopal reserve 19 23,530 25,651 16,995 General loan los reserve 6,543 35,125 48.312 Subordinated debt reserve 18,600 13,600 (317) (17,883) Fair value reserve (6,85) (122) 592 8,005 Special reserve 1.927 225 20,026 Impaiment reserve 7,710 172.527 144,074 Retained earning 59.469 66,423 TOTAL EQUITY ATTRIBUTABLE TO THE CH 1,8m 662,285 OWNERS OF THE BANK 254,90 2:54,627 129,870 270,130 Tier I Perpetual subordinated bonds 21 104.000 50,000 791,758 932,415 TOTAL EQUITY 358,90 304.827 5,233.680 5.949.065 TOTAL LIABILITIES AND EQUITY 2.290,390 2,014,562 Net assets value per share 46 44 (US cents / bazas 22 170 179 803,087 813,566 Contingent liabilities and commitments 23 313,223 309.189 The financial statements and notes 1 to 36 were approved by the Board of Directors on 28 January 2019 and signed on their bchall by: X 17 The Ratios: . Gross Profit Margin Operating Profit Margin Net Profit Margin Operating Ratio ROCE (Return On Capital Employed) ROE (Return On Equity) . Current Ratio Quick Ratio Super Quick Ratio Or Cash Ratio Receivables Turnover And Days Inventory Turnover And Days Payables Turnover And Days - Cash Conversion Cycle Debt Ratio Debt/Equity Ratio Interest Coverage Ratio Equity Multiplier 2017 USS 000 Note 2018 RO 9001 24 25 200,052 (101322) 98.730 34,042 91,367 (46,617) 44,750 16,588 2017 RO 900 77,020 (39,009) 38.011 13,106 (16,930) (9,284) 16518) 17.112 7,304 6,588 26 115,842 30.070 145,912 (10,754) 52,054 10.099 62,153 (5.104) (4) 44,599 11,572 56,176 (4,140) 2018 USS '000 237,317 Interest income (121.083) Interest expense 116,234 NET INTEREST INCOME 43,086 Income from Islamic financing and investments Unrestricted investment account holders' state of protit (24,114) and profit expense NET INCOME FROM ISLAMIC FINANCING AND 18,972 INVESTMENTS NET INTEREST INCOME AND INCOME FROM 135,206 ISLAMIC FINANCING AND INVESTMENTS 26,231 Other operating income 161,437 OPERATING INCOME (13,257) Net impairment on financial assets (10) Loans & advances and financing written off 148,170 NET OPERATING INCOME (38,777) Staff expenses (3,592) Depreciation (18.026) Other operating expenses (60,395) OPERATING EXPENSES 87,775 PROFIT BEFORE TAXATION (13,005) Tax expense 74,770 PROFIT FOR THE YEAR OTHER COMPREHENSIVE EXPENSE - NET OF Items that will not be reclassified to profit or loss (2,486) Equity investment at FVOCI - net changes in fair value 68 Realised gain on cquity investment at FVOCI Items that will be reclassified to profit or loss Net amount transferred to profit or loss (317) Fair value hedge - net changes in fair value (10.800) Debt investment at FVOCI - nct changes in fair value OTHER COMPREHENSIVE EXPENSE FOR THE (13,535) YEAR TOTAL COMPREHENSIVE INCOME FOR THE 61,235 YEAR Basic and diluted carnings per share (US cents / baixas) 135,158 (33,410) (3,449) (16.745) (53.604) 81,554 (12,288) 69.266 27 10 2x 57,045 (14,929) (1.383) (6,940) (23.252) 52,036 (12,863) (1,328) (6447) (20.638) 31,398 14.731) 26,667 33,793 (5,007) 28,786 (957) 26 (1.397) (538) (122) (4,158) (1,397) (5,211) (538) 67,869 23,575 26,129 29 19 18 The accompanying notes form an integral part of these financial statement Report of the independent Auditors - page 1 2017 USS 000 2018 USS '000 2018 R0 (100 2017 RO 2012 Note 6 7 ASSETS 302.930 398.457 Cash and balances with Central Bank of Oman 153.406 116,628 43,036 62.408 Due from banks 24,027 16.569 4,245,345 4.858.901 Loans & advances and financing. net 1.870,677 1,634,458 562,964 555,971 Investment securities 9 214,049 216,741 43,384 45.429 Property and equipment 10 17,490 16,703 35,021 27.899 Other assets 12 10,741 13,453 5,222.680 5,949,065 TOTAL ASSETS 2,290,390 2.014582 LIABILITIES 346,922 381,239 Due to banks 13 146,777 133,565 3,768 444 4,315,961 Customers' deposits 14 1.661,645 1,450,851 150,000 135.000 Borrowed funds 15 51,975 57,750 810 652 Deferred tax liability 11 251 312 109,811 118.863 Other liabilities 16 45,762 42,277 64,935 64.925 Subordinated liabilities 17 25.000 25,000 4,440.922 5,016,650 TOTAL LIABILITIES 1.931,410 1,700.755 EQUITY 370,140 388,647 Share capital IN 149,629 142,504 66.626 74,104 Legal reserve 19 28.8.10 25.631 16,995 General loan los reserve N 6.541 35,325 48,312 Subordinated debt reserve 17 18,600 13.600 017) (17.883) Fair value reserve (6.885) (122) 592 5,005 Special reserve X 1.927 228 20,026 Impairment reserve 7,710 172,527 144,074 Retained carning 55.469 66,423 TOTAL EQUITY ATTRIBUTABLE TO THE 661,88 662,285 OWNERS OF THE BANK 254,9NO 254.27 120x70 170,130 Tier I Perpetual subordinated bonds 21 104,000 50.000 791.758 932,415. TOTAL EQUITY 358,980 304,627 3,232.680 5,949,065 TOTAL LIABILITIES AND EQUITY 2.290,390 2.014.312 Net assets value por share 44 (US cons/baras) 170 179 803.087 $13,566 Contingent liabilities and commitments 23 313,223 309.189 The financial statements and notes I to 36 were approved by the Board of Directors on 28 January 2019 and signed on their bchall by 2019 USS '000 2020 USS 000 2020 60 "Won 2019 RO DOO Note 274,036) (157 8421 116,194 25 26 112.604 (63,754) 48.850 103,504 60,769 44,735 49,527 25 18,654 19,068 (17.569) 26 7.410) (6,764 31,958 11.244 12,304 26,662 (678) 25,984 28 28 8.161 (540) 7.621 10,265 (261) 10,004 7,029 27 3.781 2.706 71.496 (14.402) 57,094 181,165 (15,249) 165.916 (44,194) (5,907) (21.713) 171.814) 94.102 (13,543) 80,559 292.473 Interest income (165.595) Interest expense 126,883 NET INTEREST INCOME 48,452 Income from Islame financing and investments Unrestricted investment account holders' share of profit (19.247) and profit expense NET INCOME FROM ISLAMIC FINANCING AND 29,205 INVESTMENTS 21,197 Fees and commission income (1,403) Fees and commission expense 19,794 Net fees and commission income 9,821 Other operating income 185,703 OPERATING INCOME (37,408) Nct impairment on financial assets 148.295 NET OPERATING INCOME (48.288) Staff expenses (6,774) Depreciation and amortisation (23,106) Other operating expenses (78,168) OPERATING EXPENSES 70,127 PROFIT BEFORE TAXATION (7,873) Tax expense 62,254 PROFIT FOR THE YEAR OTHER COMPREHENSIVE INCOME /(LOSS) Items that will not be reclassified to profit or loss 278 Equity investments at FVOCI.net changes in fair value *1 Realized gain on equity investment at FVOCI Items that will be reclassified to profit or less (4.203) Cash flow hedge - net changes in fair value 4,358 Changes in fair value of FVOCI debt investments - net OTHER COMPREHENSIVE INCOME FOR THE 514 YEAR TOTAL COMPREHENSIVE INCOME FOR THE 62,768 YEAR 30 10 31 (18.591) (2.605) (8896) (30.095) 26,999 (3.031) 23,968 69,749 15871 63,878 (17015) (2,274) 18,360) (27,649) 36.229 (5,214) 31,015 12 107 31 (556) 64 166 (473) 8,743 (1.618) 1.678 (182) 3.366 2.692 6,992 198 87.551 24,166 33,707 Basic and diluted camnings per share (US cents / baras) 15 The accompanying notes form an integral part of these financial statements. Report of the independent auditors - pages 2-6, Note 6 7 9 STATEMENT OF FINANCIAL POSITION AS AT 31 DECEMBER 2020 2019 2020 2020 2019 USS 000 USS 000 RO 100 RO (MM) ASSETS 281,797 205,247 Cash and balances with Central Bank of Oman 79,020 108.492 130,587 119.932 Due from banks 46,174 50.276 5,337,6.26 5,763,369 Loans & advances and financing, net * 2.218,897 2,054,986 670.514 795,761 Investment securities 306,368 258.148 66,055 75,724 Other assets 13 29,154 25.431 35,049 59.387 Property and equipment 10 22.864 21,194 6,541.628 17.019,420 TOTAL ASSETS 2.702,477 2.51K.527 LIABILITIES AND EQUITY 513,519 351.283 Due to banks 14 135.244 197.705 4,446,042 4,999,101 Customers' deposits IS 1.924,654 1,711,726 330,000 415,000 Borrowed funds 16 159,775 127,050 314 743 Deferred tax liability 12 286 121 196,701 213.423 Other liabilities 17 82.168 75.730 44,156 31.169 Subordinated liabilities IN 12,000 17.000 3,530,732 6,010,719 TOTAL LIABILITIES 2,314,127 2.129.332 EQUITY 408,078 428,482 Share capital 164,966 159.110 82,161 $8.385 Legal reserve 20 34,028 31,632 36,364 29,611 Subordinated debt reserve 11.400 14,000 (10,995) (10,561) Fair value reserve (4.066) (4.233) 4,917 2.592 Special reserve 998 24,244 26,303 Impairment reserve 10,127 9,114 144,049 121.311 Retained camning 46,897 55,459 TOTAL NET EQUITY ATTRIBUTABLE TO 688818 686,623 THE OWNERS OF THE BANK 264.350 265.195 122.07% 322,078 Tier I Perpetual subordinated bonds 124.000 124.000 1010.896 1,005,701 TOTAL EQUITY INN.JSO 389.195 6,541.62% 7,019,420 TOTAL LIABILITIES AND NET EQUITY 2.702.477 2.514.527 Net assets value per share 42 (US cents / baixas 23 160 169 754,512 622.696 Contingent liabilities and commitment 219,71 290,487 The financial statements and notes 1 to 39 were approved by the Board of Directory on 27 January 2021 and signed on their behalf by: 19 IN 1.893 22 24