

Answered step by step
Verified Expert Solution
Question
1 Approved Answer
Requirements For each of the following requirements, create a new pivot table in a new worksheet. Name each new worksheet as Req 1, Req
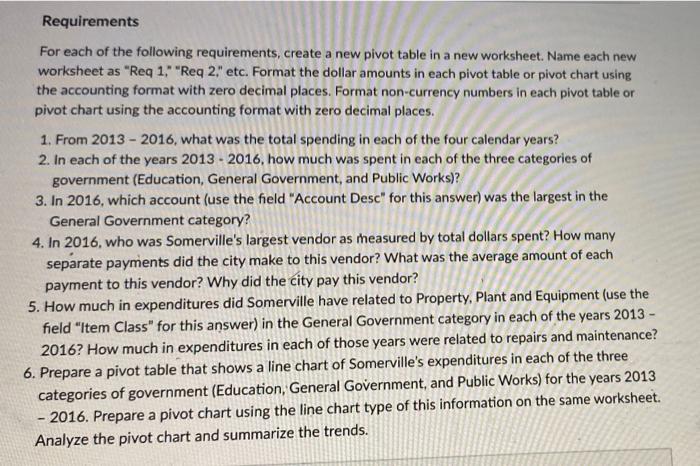
Requirements For each of the following requirements, create a new pivot table in a new worksheet. Name each new worksheet as "Req 1," "Req 2," etc. Format the dollar amounts in each pivot table or pivot chart using the accounting format with zero decimal places. Format non-currency numbers in each pivot table or pivot chart using the accounting format with zero decimal places. 1. From 2013-2016, what was the total spending in each of the four calendar years? 2. In each of the years 2013 - 2016, how much was spent in each of the three categories of government (Education, General Government, and Public Works)? 3. In 2016, which account (use the field "Account Desc" for this answer) was the largest in the General Government category? 4. In 2016, who was Somerville's largest vendor as measured by total dollars spent? How many separate payments did the city make to this vendor? What was the average amount of each payment to this vendor? Why did the city pay this vendor? 5. How much in expenditures did Somerville have related to Property, Plant and Equipment (use the field "Item Class" for this answer) in the General Government category in each of the years 2013- 2016? How much in expenditures in each of those years were related to repairs and maintenance? 6. Prepare a pivot table that shows a line chart of Somerville's expenditures in each of the three categories of government (Education, General Government, and Public Works) for the years 2013 - 2016. Prepare a pivot chart using the line chart type of this information on the same worksheet. Analyze the pivot chart and summarize the trends.
Step by Step Solution
There are 3 Steps involved in it
Step: 1
To tackle these requirements youll create pivot tables and charts based on your dataset Heres a stepbystep guide for each requirement Requirement 1 Cr...
Get Instant Access to Expert-Tailored Solutions
See step-by-step solutions with expert insights and AI powered tools for academic success
Step: 2

Step: 3
Ace Your Homework with AI
Get the answers you need in no time with our AI-driven, step-by-step assistance
Get Started
Acct 2302 Managerial Accounting
Authors: Fred Phillips Stacey Whitecotton, Robert Libby
1st Edition
1259135624, 978-1259135620