Research Question- Does body-mass index differ based on perceived well-being among Washingtonians? In other words, are Washingtonians who feel differently about their well-being differ in their body-mass index? If so, how well does perceived well-being explain BMI or vice versa? How do the groups differ and by how much? (Are there statistically significant differences in body-mass index (@_BMI4) between Washingtonians who feel differently about their well-being (GENHLTH)?
Please answer question 1 to 11 using data.
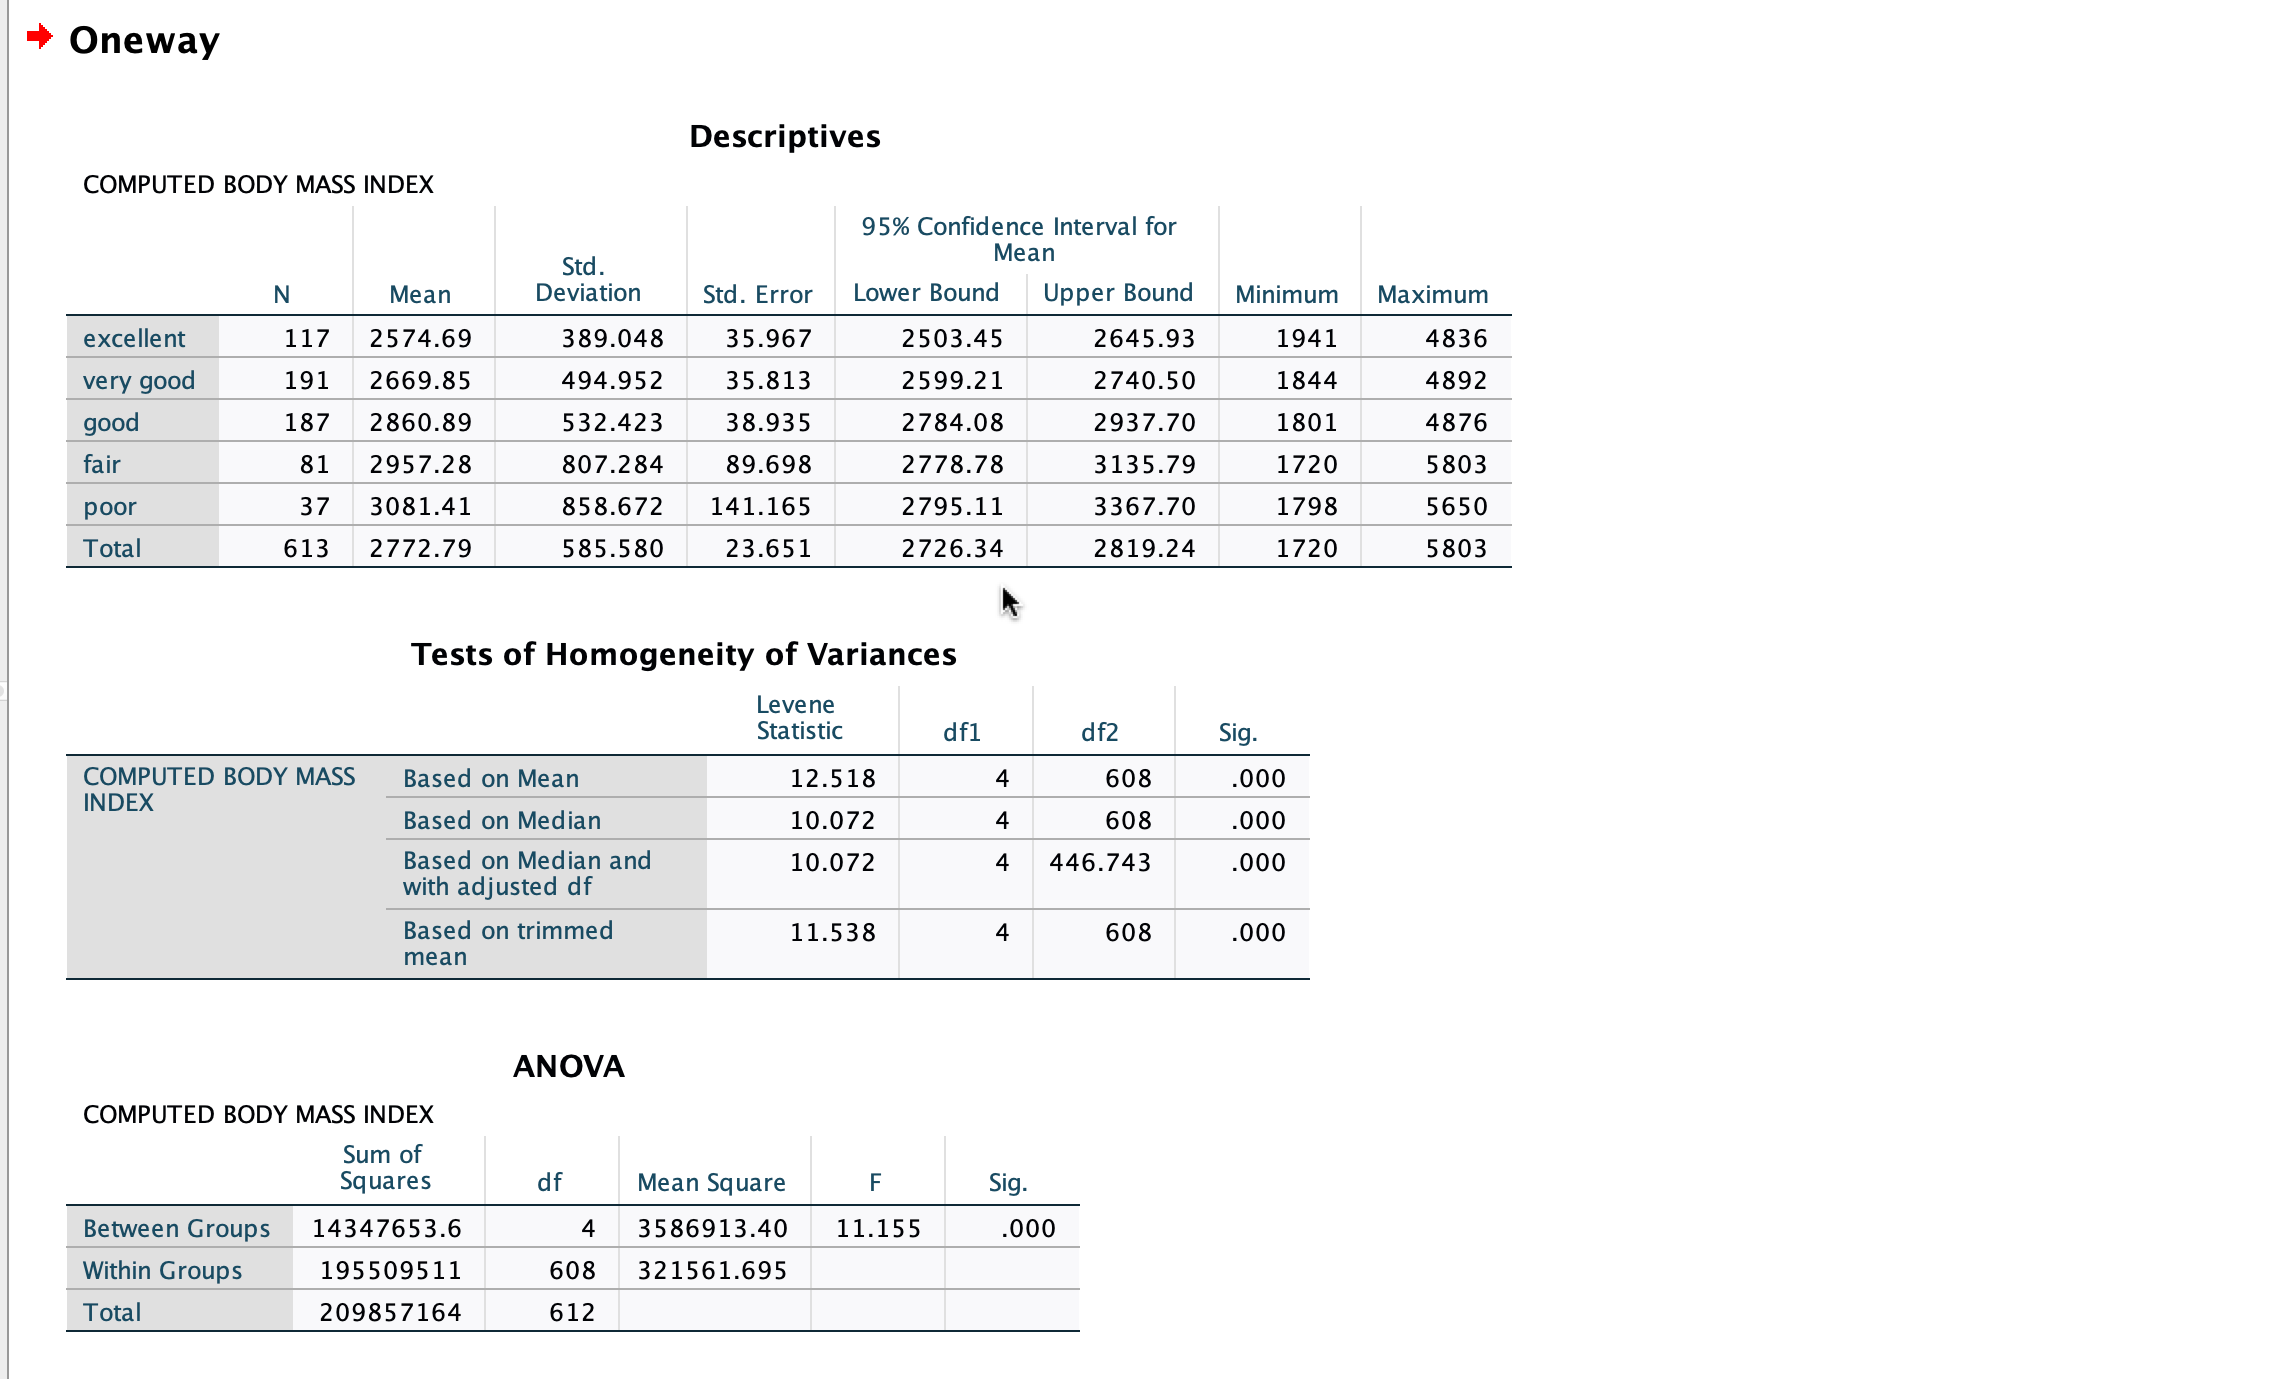
1)Descriptive statistics:
1.1 Means/SDs of BMI for each group:
1.2 Range of means for the population for each group (i.e., 95% CI for each group):
2) Do the data meet the homogeneity/equality of variance assumption? (Report and interpret the significance value Based on Mean.)
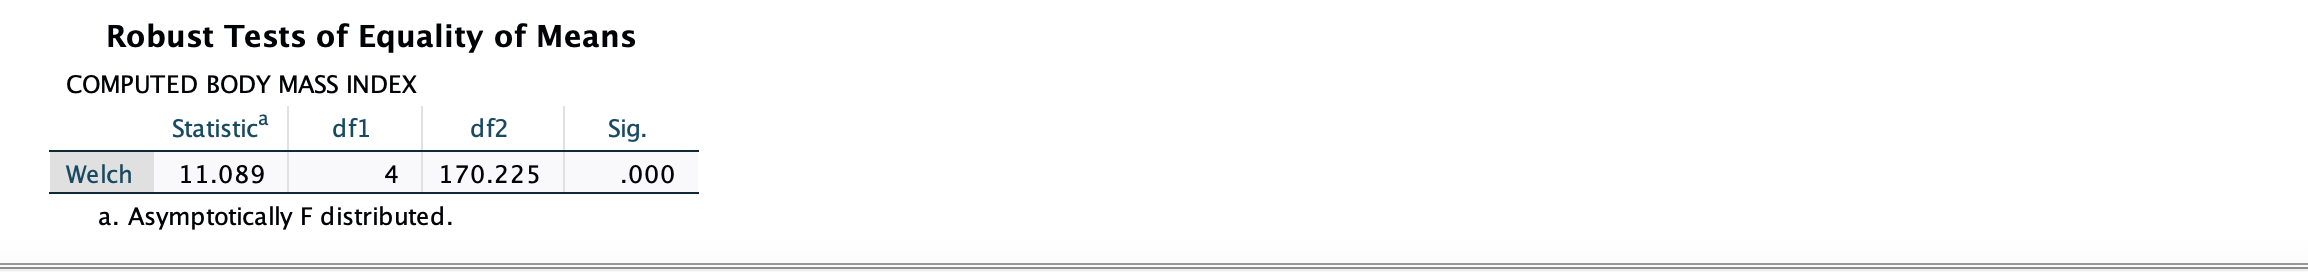
3) Is the omnibus test statistically significant? (Also specify which omnibus test you are reporting (ANOVA/Welch))
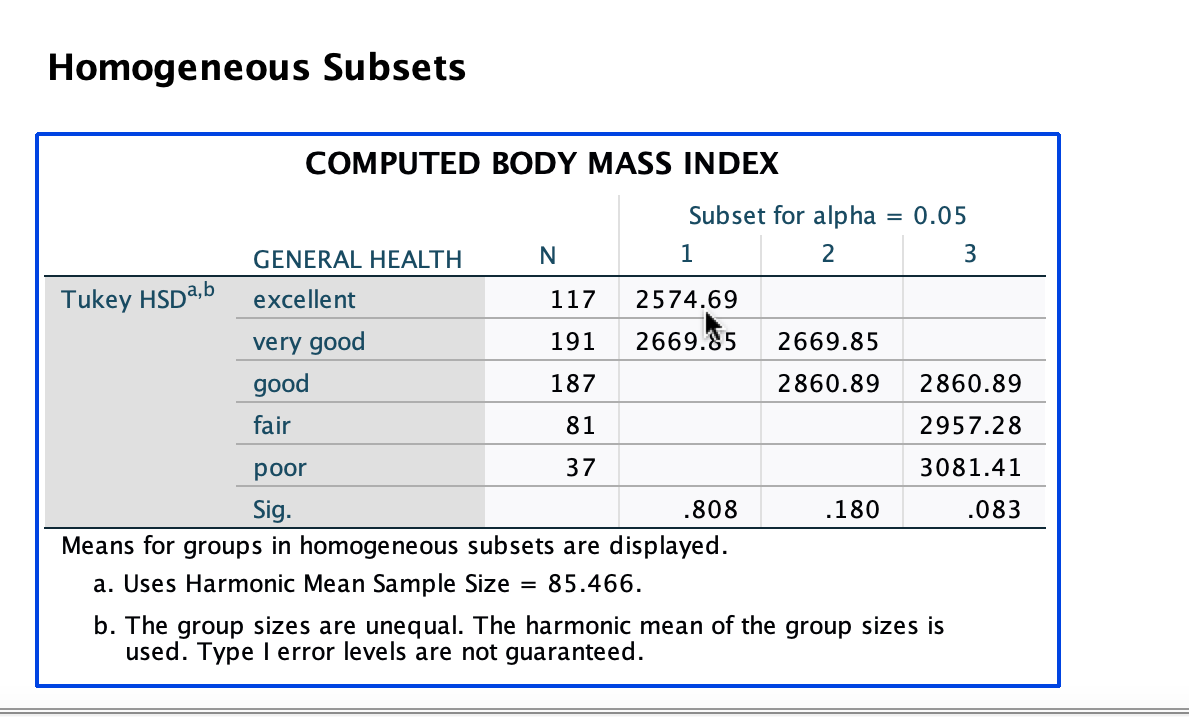
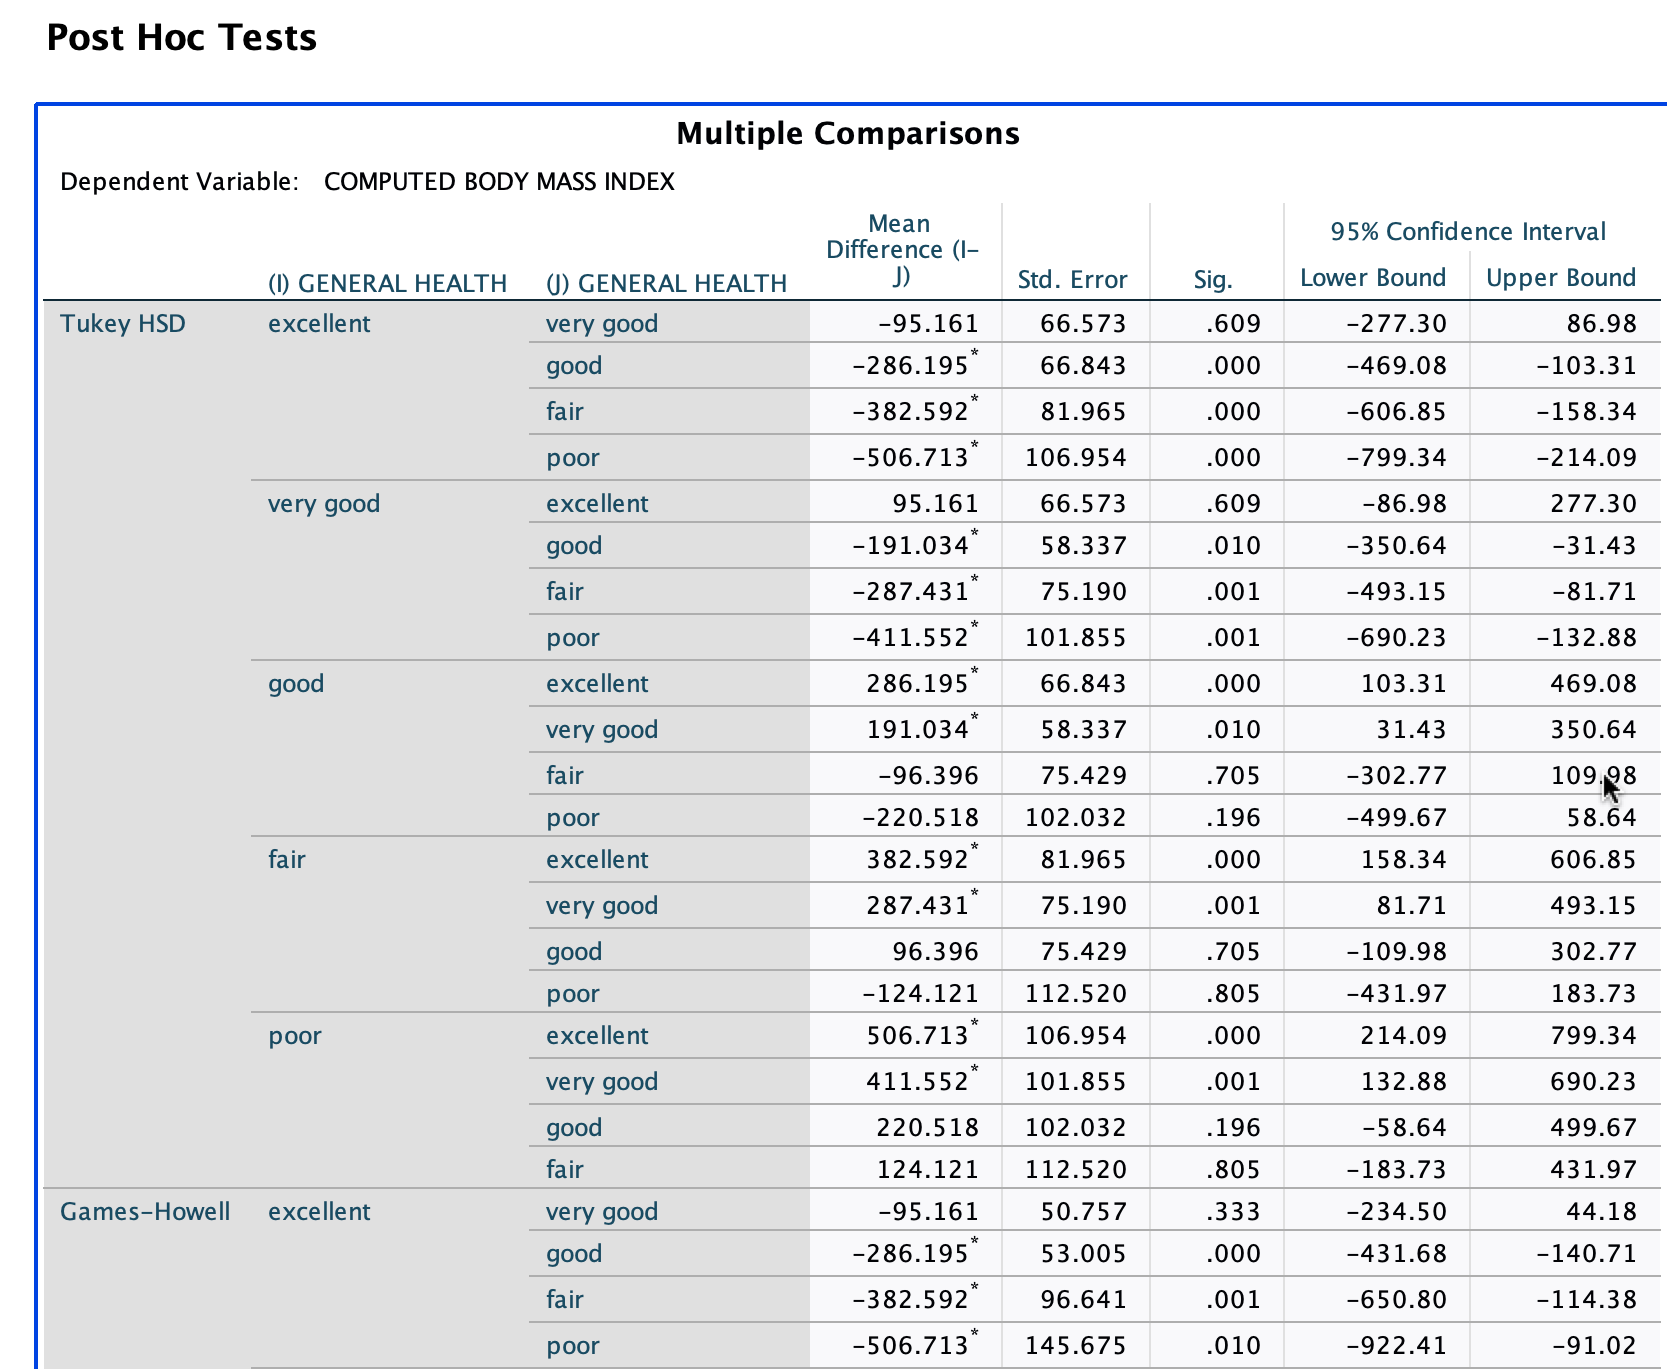
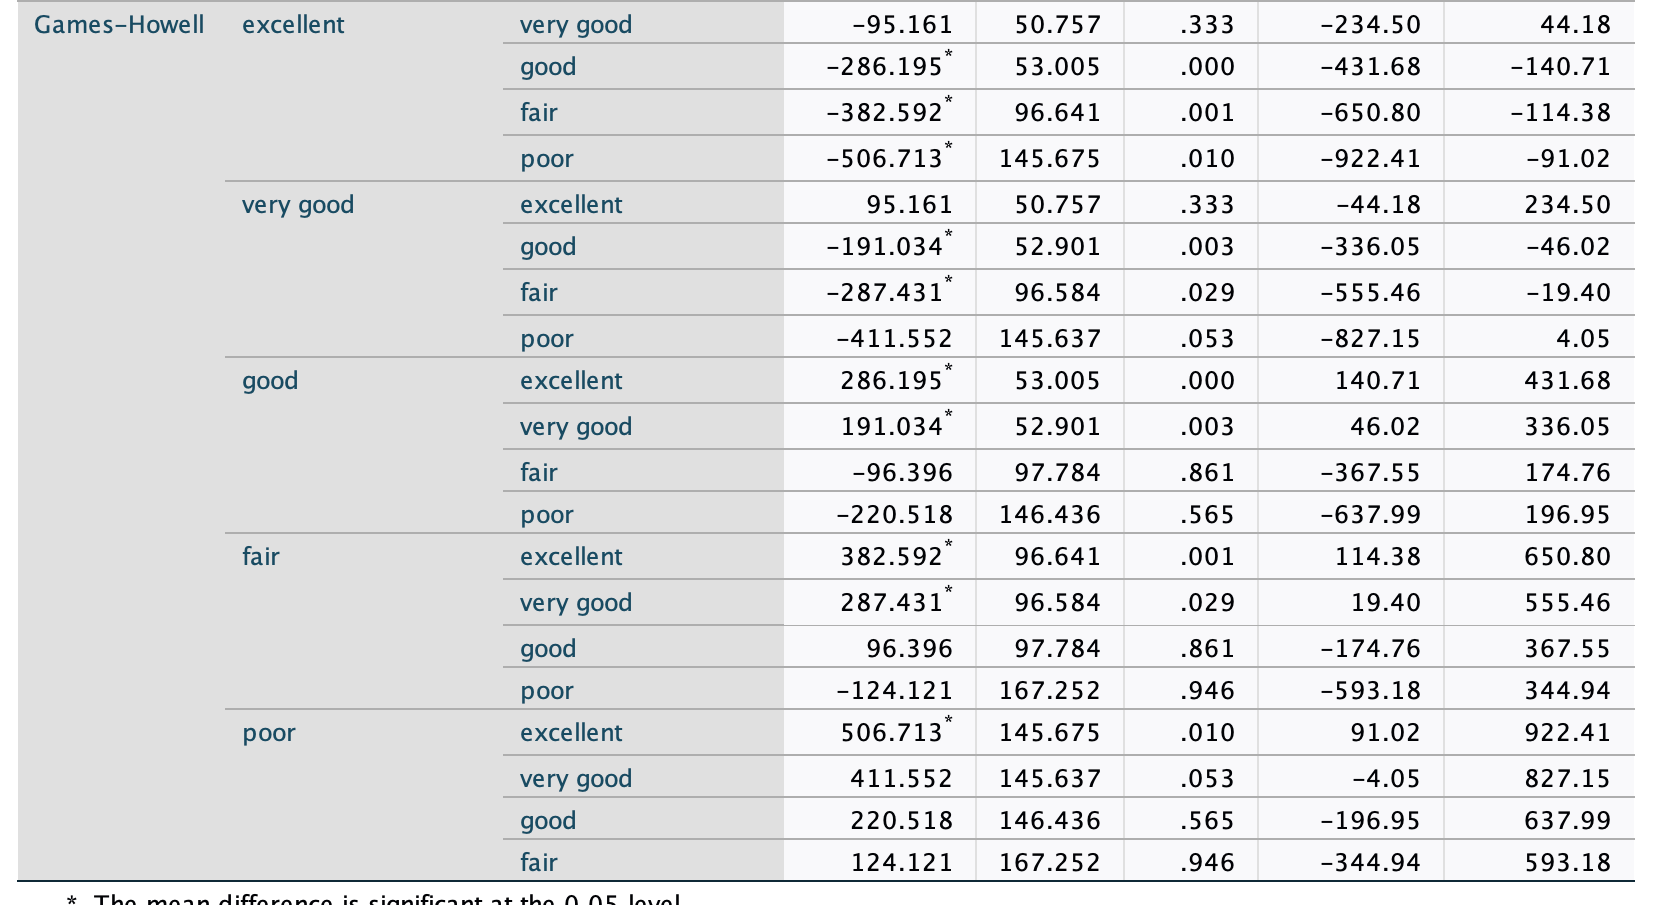
4) Which groups differ significantly? (Also specify which post-hoc test you are reporting (Tukey/Games-Howell))
5) What is the magnitude of the difference (effect size) for each group mean difference that is statistically significant as Cohen's d measure? Is the effect small, medium or large? (Calculate, report and interpret for each set of difference.)
6) Are there any significant outliers?
7) Is the distribution of BMI scores similar to normal distribution for each group? If not, how would you characterize the shape of the distributions? (Hint: look at the skewness/kurtosis values and histograms)
8) Are the variances of BMI scores equal across all groups?
9) Would you accept or reject the null hypothesis? Why?
10) What do you conclude from the analysis? How would you explain your findings in lay language to someone who has no statistical background? (summarizes your findings and conclusions.)
11) What type error are you likely to be committing, and why?
+ Oneway Descriptives COMPUTED BODY MASS INDEX 95% Confidence Interval for Std. Mean N Mean Deviation Std. Error Lower Bound Upper Bound Minimum Maximum excellent 117 2574.69 389.048 35.967 2503.45 2645.93 1941 4836 very good 191 2669.85 494.952 35.813 2599.21 2740.50 1844 4892 good 187 2860.89 532.423 38.935 2784.08 2937.70 1801 4876 fair 81 2957.28 807.284 89.698 2778.78 3135.79 1720 5803 poor 37 3081.41 858.672 141.165 2795.11 3367.70 1798 5650 Total 613 2772.79 585.580 23.651 2726.34 2819.24 1720 5803 Tests of Homogeneity of Variances Levene Statistic df1 df2 Sig. COMPUTED BODY MASS Based on Mean 12.518 4 508 000 INDEX Based on Median 10.072 4 608 000 Based on Median and 10.072 4 446.743 .000 with adjusted df Based on trimmed 11.538 4 608 .000 mean ANOVA COMPUTED BODY MASS INDEX Sum of Squares df Mean Square F Sig. Between Groups 14347653.6 4 3586913.40 11.155 000 Within Groups 195509511 608 321561.695 Total 209857164 612Robust Tests of Equality of Means COMPUTED BODY MASS INDEX Statistica df1 df2 Sig. Welch 11.089 4 170.225 000 a. Asymptotically F distributed.Homogeneous Subsets COMPUTED BODY MASS INDEX Subset for alpha = 0.05 GENERAL HEALTH 1 2 3 excellent 2574.69 very good 2669.85 2669.85 good 2860.89 2860.89 fair 81 2957.28 poor 37 3081.41 Sig. .808 .180 .083 Means for groups in homogeneous subsets are displayed. a. Uses Harmonic Mean Sample Size = 85.466. b. The group sizes are unequal. The harmonic mean of the group sizes is used. Type I error levels are not guaranteed. Means Plots 3100 3000 2900 Mean of COMPUTED BODY MASS INDEX 2800 2700 2600 2500 excellent very good good fair poor GENERAL HEALTHPost Hoc Tests Multiple Comparisons Dependent Variable: COMPUTED BODY MASS INDEX Diffgfnglge (l 95% Condence Interval (I) GENERAL HEALTH (1) GENERAL HEALTH J) Std. Error Sig. Lower Bound Upper Bound Tukey HSD excellent very good 95.161 66.573 .609 277.30 86.98 good 286.195" 66.843 .000 469.08 103.31 fair 382.592* 81.965 .000 -606.85 158.34 poor 506.713* 106.954 .000 799.34 214.09 very good excellent 95.161 66.573 .609 86.98 277.30 good 191.034* 58.337 .010 350.64 31.43 fair 287.431* 75.190 .001 493.15 81.71 poor 411.552* 101.855 .001 -690.23 132.88 good excellent 286.195. 66.843 .000 103.31 469.08 very good 191.034* 58.337 .010 31.43 350.64 fair 96.396 75.429 .705 302.77 109.28 poor 220.518 102.032 .196 499.67 58.64 fair excellent 382.592* 81.965 .000 158.34 606.85 very good 287.431" 75.190 .001 81.71 493.15 good 96.396 75.429 .705 109.98 302.77 poor 124.121 112.520 .805 431.97 183.73 poor excellent 506.713' 106.954 .000 214.09 799.34 very good 411.552' 101.855 .001 132.88 690.23 good 220.518 102.032 .196 -58.64 499.67 fair 124.121 112.520 .805 183.73 431.97 GamesHowell excellent very good 95.161 50.757 .333 234.50 44.18 good 286.195* 53.005 .000 431.68 140.71 fair 382.592* 96.641 .001 650.80 114.38 poor 506.713* 145.675 .010 922.41 91.02 Games-Howell excellent very good -95.161 50.757 .333 -234.50 44.18 good -286.195* 53.005 000 -431.68 -140.71 fair -382.592* 96.641 .001 -650.80 -114.38 poor -506.713" 145.675 .010 -922.41 -91.02 very good excellent 95.161 50.757 .333 -44.18 234.50 good -191.034 52.901 .003 -336.05 -46.02 fair -287.431" 96.584 029 -555.46 -19.40 poor -411.552 145.637 .053 -827.15 4.05 good excellent 286.195 53.005 000 140.71 431.68 very good 191.034 52.901 003 46.02 336.05 fair -96.396 97.784 .861 -367.55 174.76 poor -220.518 146.436 565 -637.99 196.95 fair excellent 382.592 96.641 001 114.38 650.80 very good 287.431* 96.584 .029 19.40 555.46 good 96.396 97.784 .861 -174.76 367.55 poor -124.121 167.252 946 -593.18 344.94 poor excellent 506.713 145.675 .010 91.02 922.41 very good 411.552 145.637 053 -4.05 827.15 good 220.518 146.436 565 -196.95 637.99 fair 124.121 167.252 .946 -344.94 593.18