

Answered step by step
Verified Expert Solution
Question
1 Approved Answer
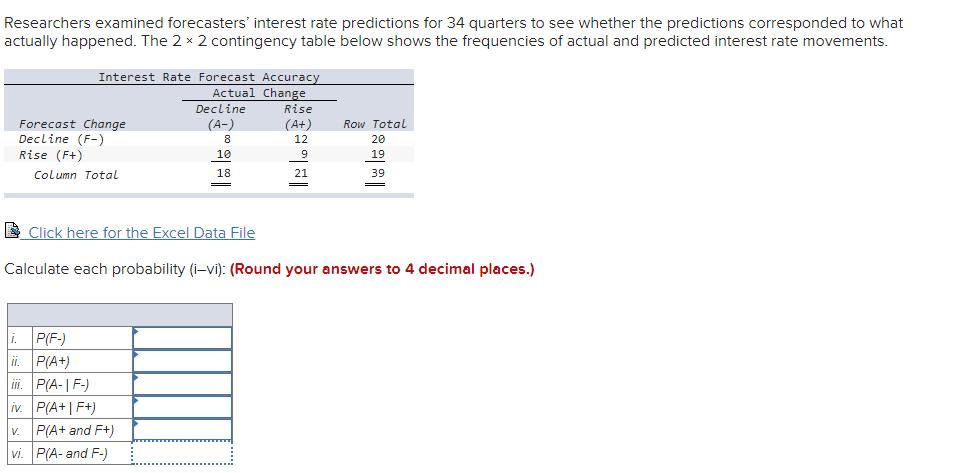
Researchers examined forecasters' interest rate predictions for 34 quarters to see whether the predictions corresponded to what actually happened. The 2 X 2 contingency table

Step by Step Solution
There are 3 Steps involved in it
Step: 1

Get Instant Access to Expert-Tailored Solutions
See step-by-step solutions with expert insights and AI powered tools for academic success
Step: 2

Step: 3
Ace Your Homework with AI
Get the answers you need in no time with our AI-driven, step-by-step assistance
Get Started
Euclidean Geometry And Transformations
Authors: Clayton W Dodge
1st Edition
0486138429, 9780486138428