

Answered step by step
Verified Expert Solution
Question
1 Approved Answer
Resource representative claims that the proportion of employees earning more than 50,000 is less than 40%. To test this claim, a random sample of
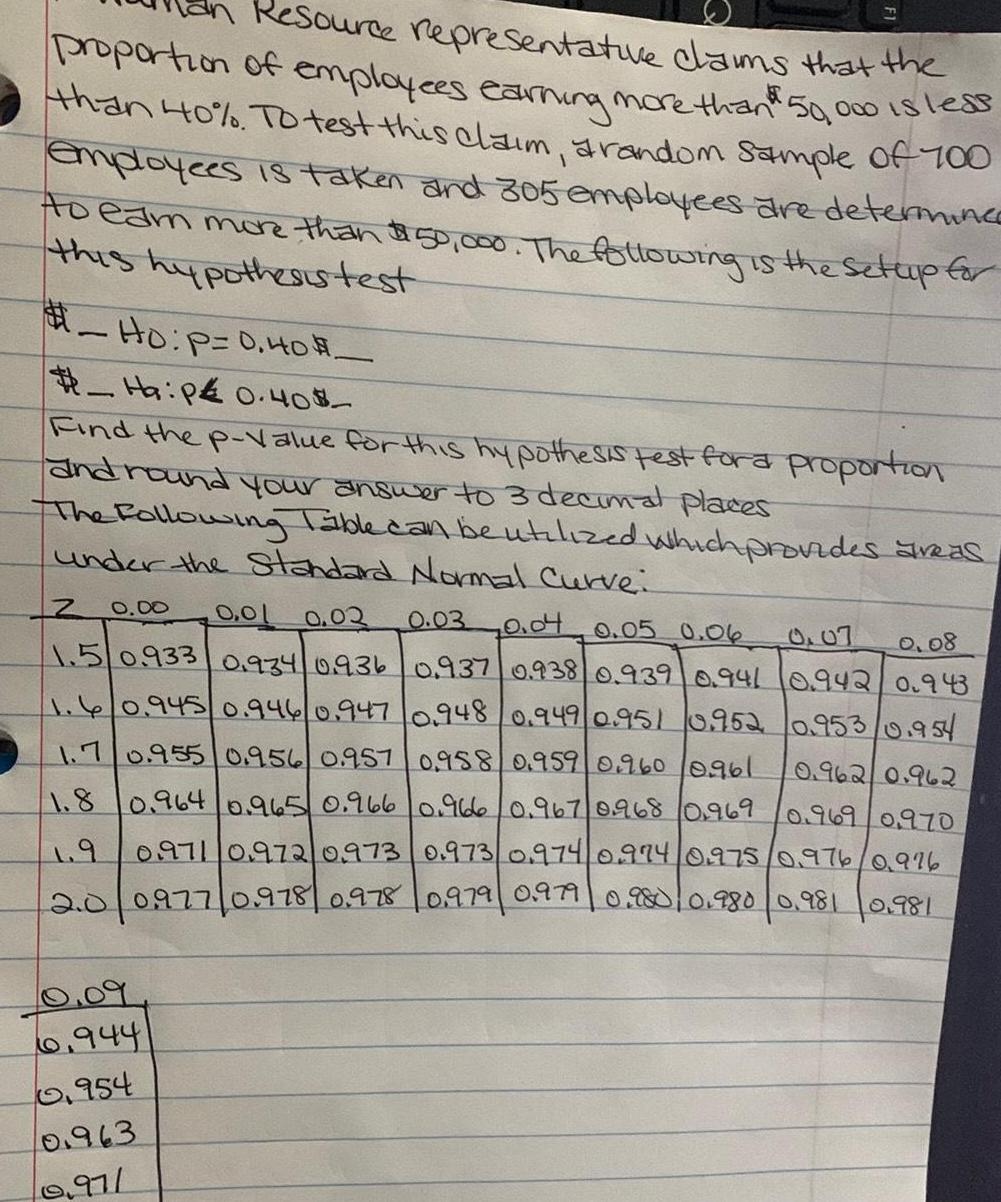
Resource representative claims that the proportion of employees earning more than 50,000 is less than 40%. To test this claim, a random sample of 700 employees is taken and 305 employees are determine to eam more than $50,000. The following is the setup for this hypothesis test -Ho: P=0.40_ -Ha: PEO.40- Find the p-value for this hypothesis test ford proportion and round your answer to 3 decimal places The Following Table can be utilized which provides areas under the Standard Normal Curve: 0.04 0.05 0.06 2 0.00 0.01 0.02 0.03 0.07 0.08 1.5 0.933 0.934 0.936 0.937 0.938 0.939 0.941 0.942 0.943 1.6 0.945 0.946 0.947 0.948 0.949 0.951 0.952 0.953/0.954 1.7 0.955 0.956 0.957 0.958 0.959 0.960 0.961 0.962 0.962 1.8 0.964 0.965 0.966 0.966 0.967 0.968 0.969 0.9690.970 1.9 0.971 0.972 0.973 0.973 0.974 0.974 0.975/0.976/0.976 2.0/0.977/0.978/0.978/0.979/0.979/0.980/0.980/0.981/0.981 0.09 6.944 0.954 0.963 0.971
Step by Step Solution
There are 3 Steps involved in it
Step: 1

Get Instant Access to Expert-Tailored Solutions
See step-by-step solutions with expert insights and AI powered tools for academic success
Step: 2

Step: 3
Ace Your Homework with AI
Get the answers you need in no time with our AI-driven, step-by-step assistance
Get Started
Quantitative Methods For Business Management And Finance
Authors: Louise Swift, Sally Piff
2nd Edition
1403935289, 9781403935281