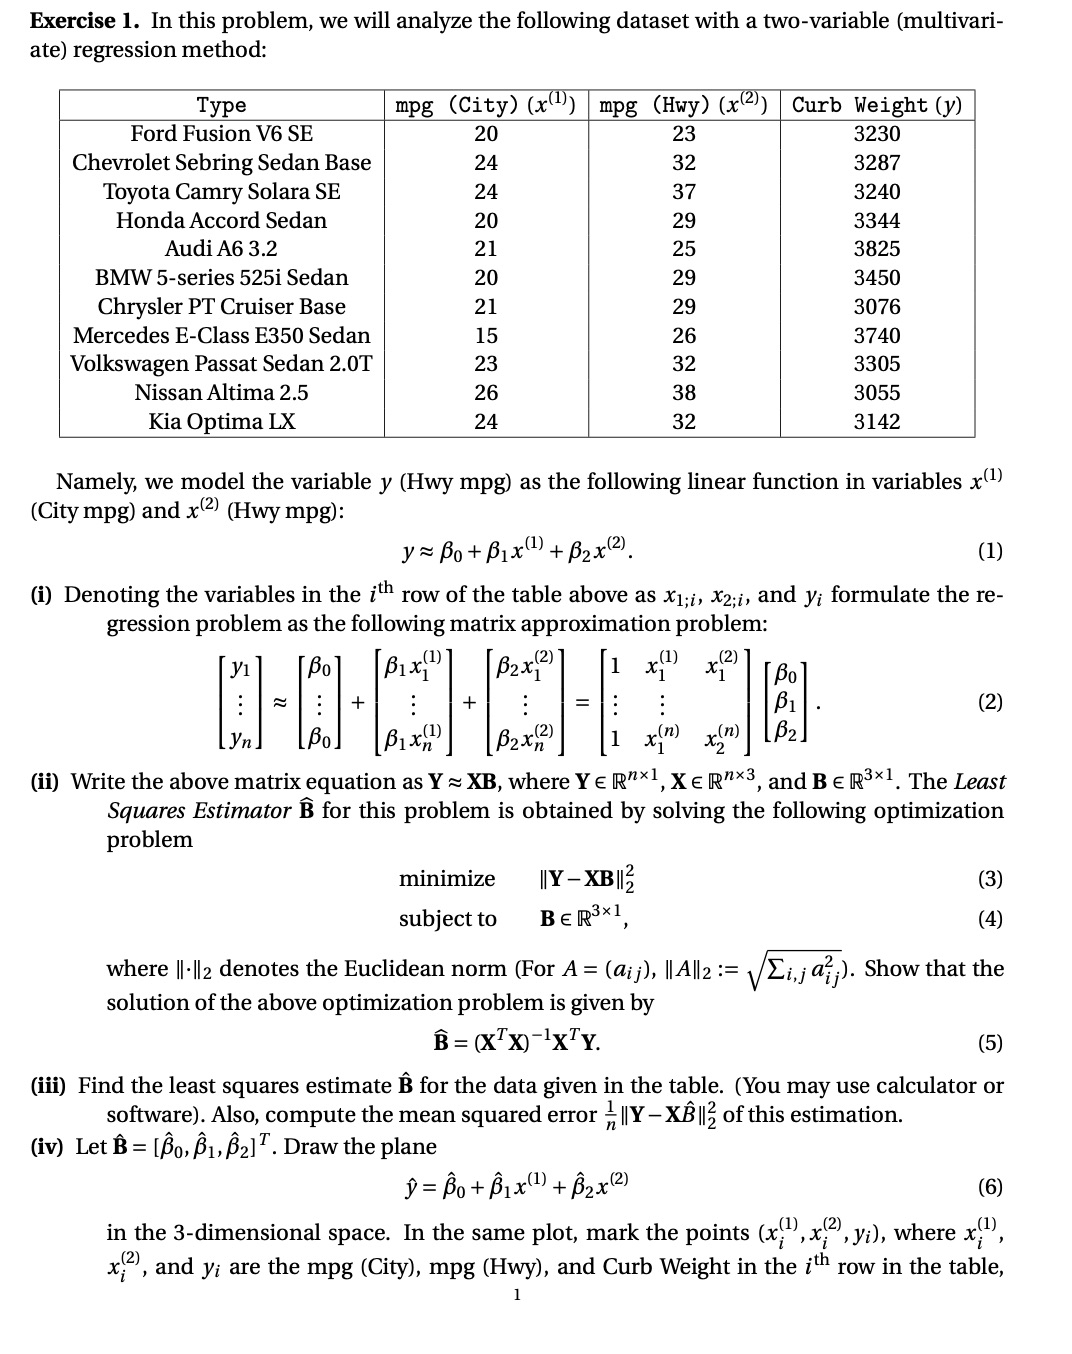
respectively. Does this multivariate regression model in (1) give a reasonable explanation of the variable y (Curb Weight)? (v) Suppose we have a new car, Ford Bronco. From test driving, we measured its city and hwy mpgs as 13 and 24. Using the linear model we tted above, predict the curb weight of this car. Exercise 1. In this problem, we will analyze the following dataset with a two-variable (multivari- ate) regression method: Type mpg (City) (x(1)) mpg (Hwy) (x )) Curb Weight (y) Ford Fusion V6 SE 20 23 3230 Chevrolet Sebring Sedan Base 24 32 3287 Toyota Camry Solara SE 24 37 3240 Honda Accord Sedan 20 29 3344 Audi A6 3.2 21 25 3825 BMW 5-series 525i Sedan 20 29 3450 Chrysler PT Cruiser Base 21 29 3076 Mercedes E-Class E350 Sedan 15 26 3740 Volkswagen Passat Sedan 2.0T 23 32 3305 Nissan Altima 2.5 26 38 3055 Kia Optima LX 24 32 3142 Namely, we model the variable y (Hwy mpg) as the following linear function in variables x(1) (City mpg) and x 2)(Hwy mpg): y = Bot Bix()+ B2x(2). (1) (i) Denoting the variables in the ith row of the table above as X1;i, x2;1, and y; formulate the re- gression problem as the following matrix approximation problem: Bo B1 (2) B2 (ii) Write the above matrix equation as Y ~ XB, where Y E Rx], XER"x3, and BER3x]. The Least Squares Estimator B for this problem is obtained by solving the following optimization problem minimize IY - XB Il3 (3) subject to BER3x1 (4) where II.1/2 denotes the Euclidean norm (For A = (ajj), IlAll2 := \\Zija;;). Show that the solution of the above optimization problem is given by B = (X X)-1XTY. (5) (iii) Find the least squares estimate B for the data given in the table. (You may use calculator or software). Also, compute the mean squared error , I|Y -XBll? of this estimation. (iv) Let B = [Bo, B1, B2]]. Draw the plane D = Bo + Bix(1) + B2x(2) (6) in the 3-dimensional space. In the same plot, mark the points (x,), x.2), ",*; , Vi), where x,), x;", and yi are the mpg (City), mpg (Hwy), and Curb Weight in the ith row in the table