Answered step by step
Verified Expert Solution
Question
1 Approved Answer
Response Quality 1 Excellent 2 Good 3 Excellent 4 Excellent 5 Good 6 Good 7 Good 8 Poor 9 Excellent 1 0 Excellent 1 1
Response Quality
Excellent
Good
Excellent
Excellent
Good
Good
Good
Poor
Excellent
Excellent
Poor
Good
Fair
Good
Good
Good
Good
Poor
Excellent
Excellent
Excellent
Good
Good
Good
Excellent
Good
Excellent
Excellent
Good
Good
Good
Poor
Excellent
Excellent
Poor
Good
Fair
Good
Good
Good
Good
Poor
Fair
Excellent
Excellent
Good
Good
Good
Fair
Good
Fair
Excellent
Good
Good
Good
Poor
Excellent
Excellent
Poor
Good
Fair
Good
Good
Good
Good
Poor
Fair
Excellent
Excellent
Good
Good
Good
Fair
Good
Fair
Excellent
Good
Good
Good
Poor
Excellent
Excellent
Poor
Good
Fair
Good
Good
Good
Good
Poor
Fair
Excellent
Excellent
Good
Good
Good
Fair
Good
Fair
Excellent
Good
Good
Good
Poor
Excellent
Excellent
Poor
Good
Fair
Good
Good
Good
Good
Poor
Fair
Excellent
Excellent
Good
Good
Good
Fair
Good
Fair
Excellent
Good
Good
Good
Poor
Excellent
Excellent
Poor
Good
Fair
Good
Good
Good
Good
Poor
Fair
Excellent
Excellent
Good
Good
Good
Fair
Good
Fair
Excellent
Good
Good
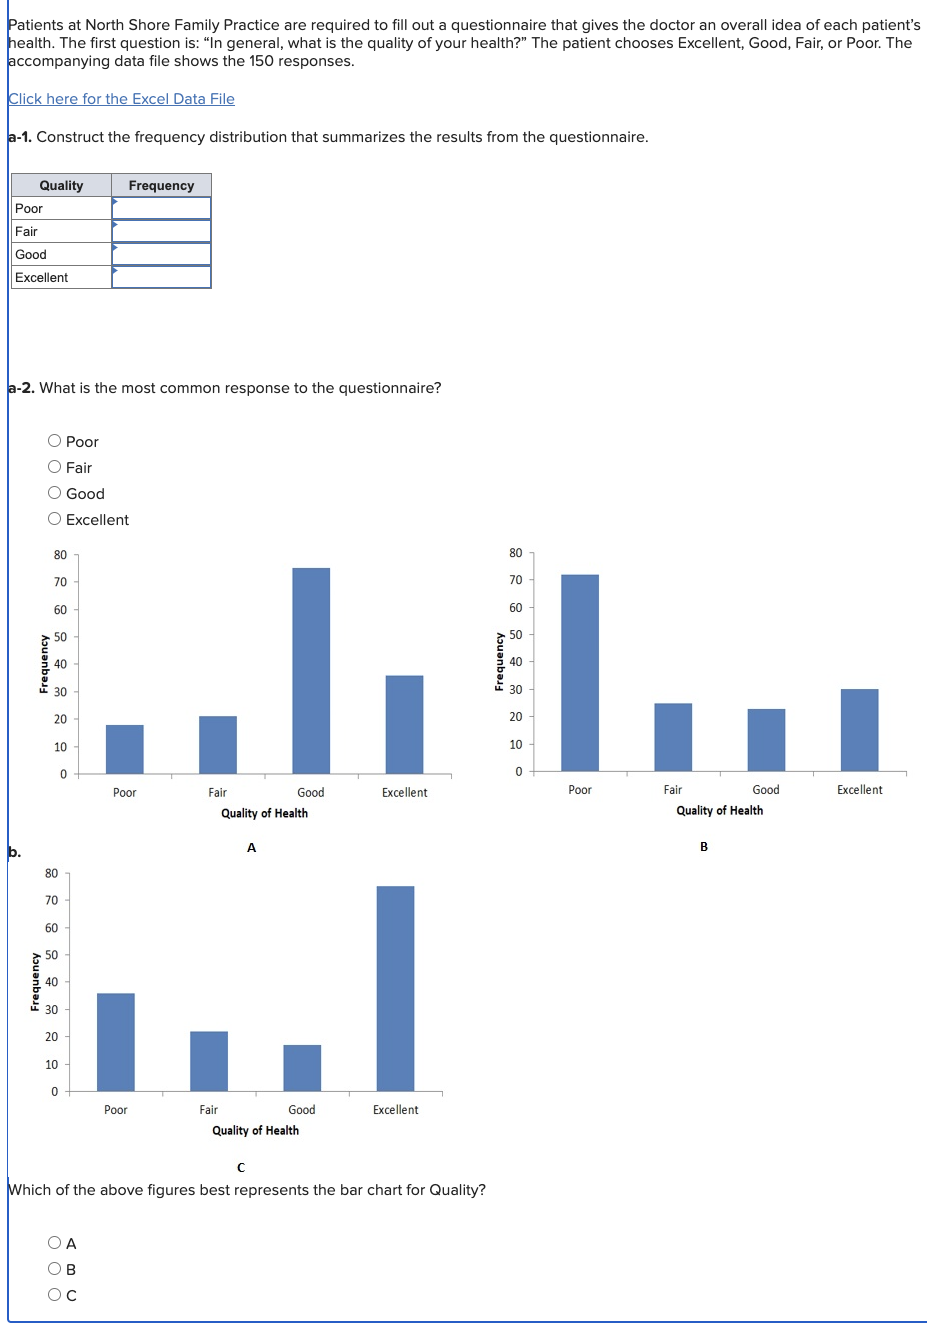
Patients at North Shore Family Practice are required to fill out a questionnaire that gives the doctor an overall idea of each patient's
health. The first question is: In general, what is the quality of your health?" The patient chooses Excellent, Good, Fair, or Poor. The
accompanying data file shows the responses.
Click here for the Excel Data File
a Construct the frequency distribution that summarizes the results from the questionnaire.
a What is the most common response to the questionnaire?
Poor
Fair
Good
Excellent
b
A
B
c
Which of the above figures best represents the bar chart for Quality?
A
B
C

Step by Step Solution
There are 3 Steps involved in it
Step: 1

Get Instant Access to Expert-Tailored Solutions
See step-by-step solutions with expert insights and AI powered tools for academic success
Step: 2

Step: 3

Ace Your Homework with AI
Get the answers you need in no time with our AI-driven, step-by-step assistance
Get Started


