Answered step by step
Verified Expert Solution
Question
1 Approved Answer
Revenue Per Available Seat Hour (RPASH) project Analysis = Part! The following project will demonstrate the value of filling every seat for every hour that

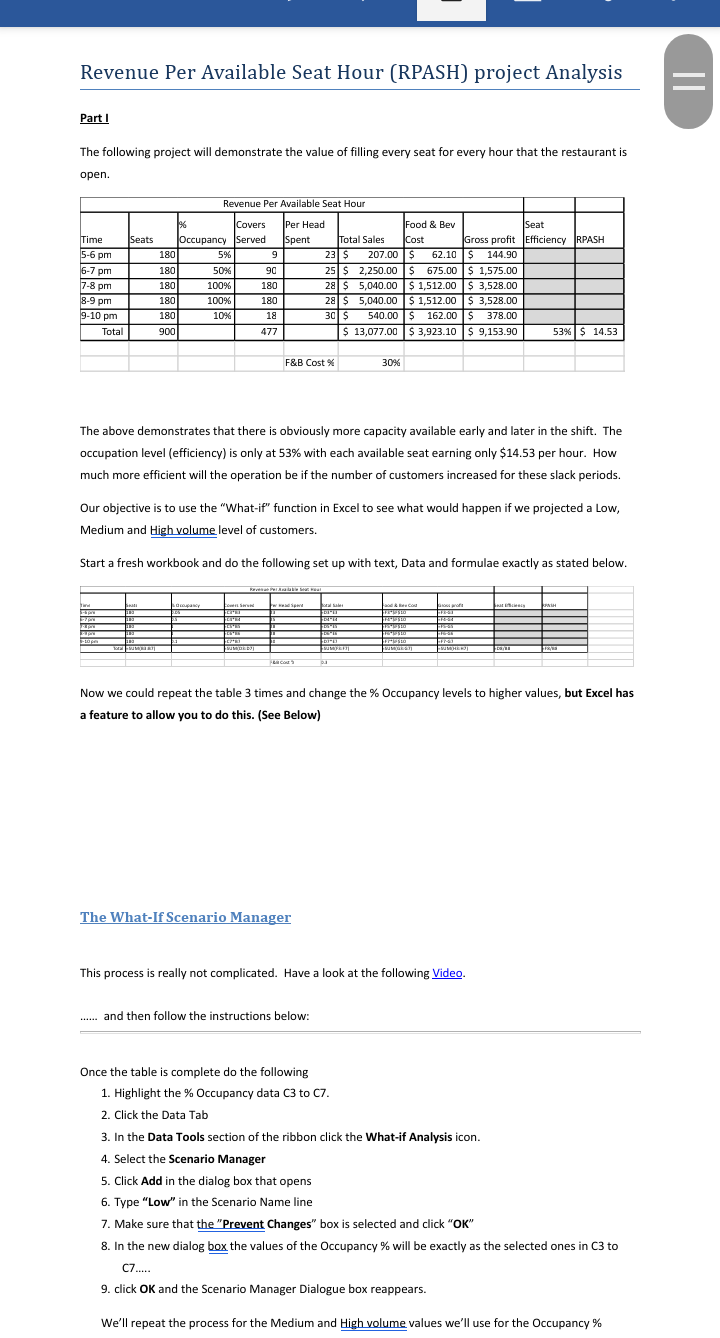
Revenue Per Available Seat Hour (RPASH) project Analysis = Part! The following project will demonstrate the value of filling every seat for every hour that the restaurant is open. Time 5-6 pm 6-7 pm Revenue Per Available Seat Hour 1% Covers Per Head Food & Bev Seat Seats Occupancy Served Spent Total Sales Cost Gross profit Efficiency RPASH 180 5% 5 9 23 $ 207.00 $ 62.10 S 144.90 $ 180 50% 90 25 $ 2,250.00 $ 675.00 $ 1,575.00 180 100% 180 28 $ 5,040.00 $ 1,512.00$ 3,528.00 180 100% 180 28 $ 5,040.00 $ 1,512.00 $ 3,528.00 180 10% 19 30 S 540.00 $ 162.00 $ 378.00 900 477 $ 13,077.00$ 3,923.10 $ 9,153.90 53% $ 14.53 7-8 pm 8-9 pm 9-10 pm Total F&B Cost % 30% The above demonstrates that there is obviously more capacity available early and later in the shift. The occupation level (efficiency) is only at 53% with each available seat earning only $14.53 per hour. How much more efficient will the operation be if the number of customers increased for these slack periods. Our objective is to use the "What-if" function in Excel to see what would happen if we projected a Low, Medium and High volume level of customers. Start a fresh workbook and do the following set up with text, Data and formulae exactly as stated below. Bad CS www Tovu TRACT TA 10 EF NO FREE WEB DEBUT ENCO Now we could repeat the table 3 times and change the % Occupancy levels to higher values, but Excel has a feature to allow you to do this. (See Below) The What-If Scenario Manager This process is really not complicated. Have a look at the following Video. ...... and then follow the instructions below: Once the table is complete do the following 1. Highlight the % Occupancy data C3 to C7. 2. Click the Data Tab 3. In the Data Tools section of the ribbon click the What-if Analysis icon. 4. Select the Scenario Manager 5. Click Add in the dialog box that opens 6. Type "Low" in the Scenario Name line 7. Make sure that the "Prevent Changes" box is selected and click "OK" 8. In the new dialog box the values of the Occupancy % will be exactly as the selected ones in C3 to C7..... 9. click OK and the Scenario Manager Dialogue box reappears. We'll repeat the process for the Medium and High volume values we'll use for the Occupancy % Revenue Per Available Seat Hour (RPASH) project Analysis = Part! The following project will demonstrate the value of filling every seat for every hour that the restaurant is open. Time 5-6 pm 6-7 pm Revenue Per Available Seat Hour 1% Covers Per Head Food & Bev Seat Seats Occupancy Served Spent Total Sales Cost Gross profit Efficiency RPASH 180 5% 5 9 23 $ 207.00 $ 62.10 S 144.90 $ 180 50% 90 25 $ 2,250.00 $ 675.00 $ 1,575.00 180 100% 180 28 $ 5,040.00 $ 1,512.00$ 3,528.00 180 100% 180 28 $ 5,040.00 $ 1,512.00 $ 3,528.00 180 10% 19 30 S 540.00 $ 162.00 $ 378.00 900 477 $ 13,077.00$ 3,923.10 $ 9,153.90 53% $ 14.53 7-8 pm 8-9 pm 9-10 pm Total F&B Cost % 30% The above demonstrates that there is obviously more capacity available early and later in the shift. The occupation level (efficiency) is only at 53% with each available seat earning only $14.53 per hour. How much more efficient will the operation be if the number of customers increased for these slack periods. Our objective is to use the "What-if" function in Excel to see what would happen if we projected a Low, Medium and High volume level of customers. Start a fresh workbook and do the following set up with text, Data and formulae exactly as stated below. Bad CS www Tovu TRACT TA 10 EF NO FREE WEB DEBUT ENCO Now we could repeat the table 3 times and change the % Occupancy levels to higher values, but Excel has a feature to allow you to do this. (See Below) The What-If Scenario Manager This process is really not complicated. Have a look at the following Video. ...... and then follow the instructions below: Once the table is complete do the following 1. Highlight the % Occupancy data C3 to C7. 2. Click the Data Tab 3. In the Data Tools section of the ribbon click the What-if Analysis icon. 4. Select the Scenario Manager 5. Click Add in the dialog box that opens 6. Type "Low" in the Scenario Name line 7. Make sure that the "Prevent Changes" box is selected and click "OK" 8. In the new dialog box the values of the Occupancy % will be exactly as the selected ones in C3 to C7..... 9. click OK and the Scenario Manager Dialogue box reappears. We'll repeat the process for the Medium and High volume values we'll use for the Occupancy %
Step by Step Solution
There are 3 Steps involved in it
Step: 1

Get Instant Access to Expert-Tailored Solutions
See step-by-step solutions with expert insights and AI powered tools for academic success
Step: 2

Step: 3

Ace Your Homework with AI
Get the answers you need in no time with our AI-driven, step-by-step assistance
Get Started


