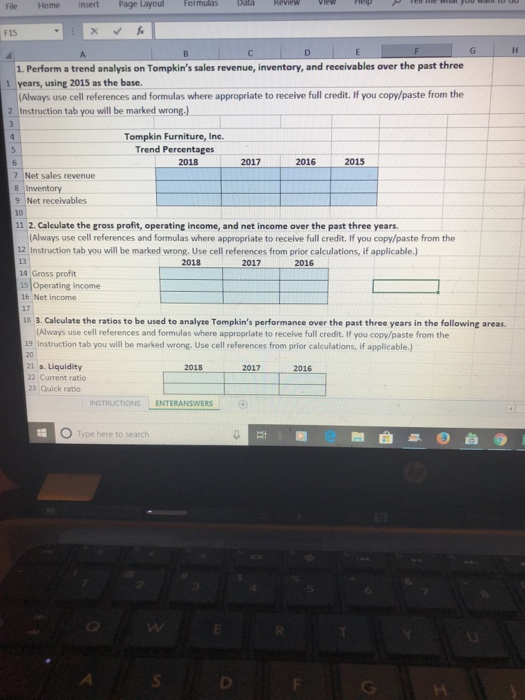
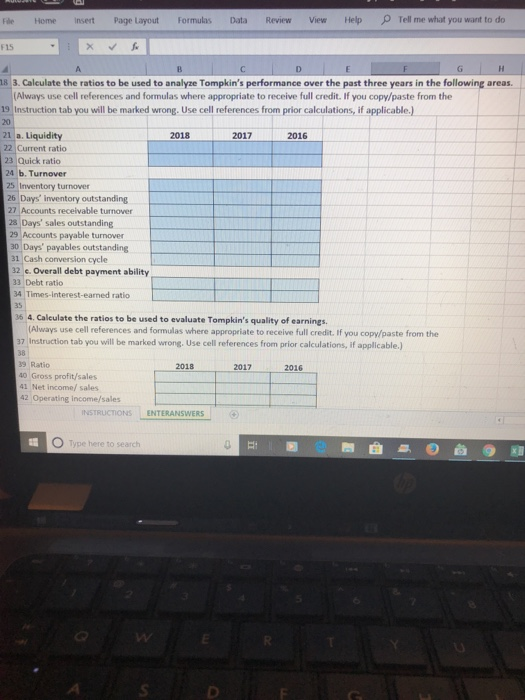
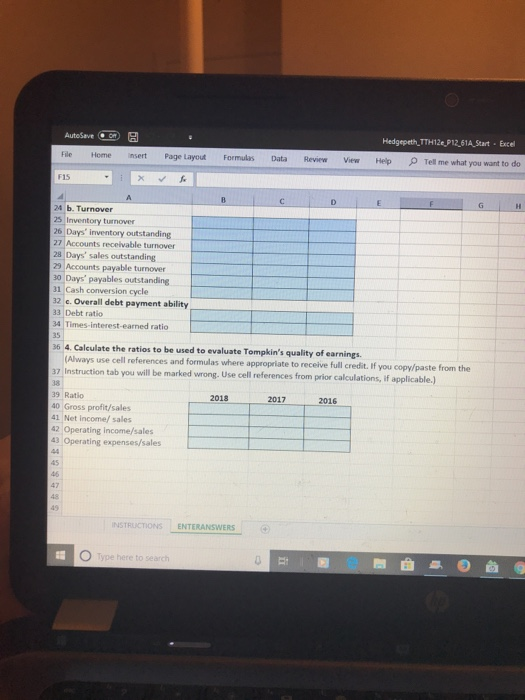
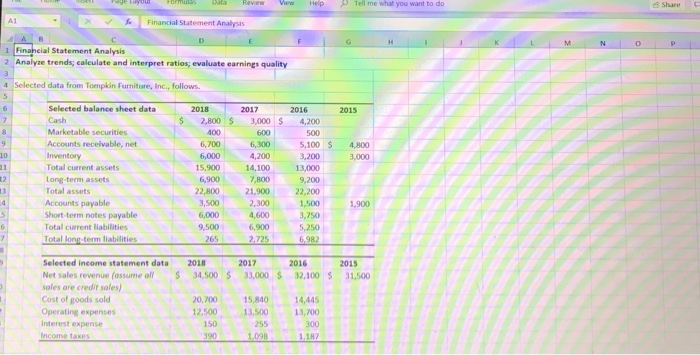
Reviea 7 File Home insert Page LayoutFormulasbala F15 1. Perform a trend analysis on Tompkin's sales revenue, inventory, and receivables over the past three 1 years, using 2015 as the base. Always use cell references and formulas where appropriate to receive full credit. If you copy/paste from the 2 Instruction tab you will be marked wrong.) Tompkin Furniture, Inc. Trend Percentages 2018 2017 2016 2015 Net sales revenue 8 Inventony 9 Net receivables 10 11 2. Calculate the gross profit, operating income, and net income over the past three years. Always use cell references and formulas where appropriate to receive full credit. If you copy/paste from the 12 Instruction tab you will be marked wrong. Use cell references from prior calculations, if applicable.) 13 14 Gross profit 2018 2017 2016 Operating income 16 Net income 18 3. Calculate the ratios to be used to analyze Tompkin's performance over the past three years in the following areas (Always use cell references and formulas where appropriate to receive full credit. If you copy/paste from the 19 Instruction tab you will be marked wrong. Use cell references from prior calculations, if applicable.) 20 1 a. Liquidity 2 Current ratio 23 Quick ratio 2018 2017 2016 INSTRUCTONS ENTERANSWERS OType here to search Fe Home insert Page Layout FormulasData Review View Help Tell me what you want to do F15 18 3. Caleulate the ratios to be used to analyze Tompkin's performance over the past three years in the following areas (Always use cell references and formulas where appropriate to receive full credit. If you copy/paste from the 19 Instruction tab you will be marked wrong. Use cell references from prior calculations, if applicable.) 20 21 a. Liquidity 22 Current ratio 23 Quick ratio 24 b. Turnover 25Inventory turnover 26 Days' inventory outstanding 27 Accounts receivable turmover 28 Days' sales outstanding 29 Accounts payable turnover 2018 2017 2016 30 Days' payables outstanding 31 Cash conversion cycle 2 e. Overall debt payment ability 33 Debt ratio 4 Times-Interest-earned ratio 35 6 4. Calculate the ratios to be used to evaluate Tompkin's quality of earnings. (Always use cell references and formulas where appropriate to receive full credit. If you copy/paste from the 7 Instruction tab you will be marked wrong. Use cell references from prior calculations, if applicable.) 38 39 Ratio 40 Gross profit/sales 41 Net income/ sales 42 Operating income/sales 2018 2017 2016 INSTRUCTIONS ENTERANSWERS pe here to search Hedgepeth,TTH12e,P12.61A Start Exce Formulas Data Review View Help Tell me what you want to do F15 4 b. Turnover 25 Inventory turnover 26 Days' inventory outstanding 27 Accounts receivable turnover 28 Days' sales outstanding 29 Accounts payable turnover 30 Days' payables outstanding 31 Cash conversion cycle 2 c. Overall debt payment ability 33 Debt ratio 34 Times-interest-earned ratic 35 6 4. Calculate the ratios to be used to evaluate Tompkin's quality of earnings. (Always use cell roferences and formulas where appropriate to receive full credit. If you copy/paste from the ion tab you will be marked wrong. Use cell references from prior calculations, if applicable.) 37 Instructi 38 39 Ratio 40 Gross profit/sales 41 Net income/ sales 42 Operating income/sales 2017 2016 43 Operating expenses/sales 45 46 48 49 STRUCTIONS ENTERANSWERS ayotsRevw HepTell 1 me what you want to do Shace c xFinancial Statement Analysis Finaheial Statement Analysis 2 Analyze trends;calculate and interpret ratios; evaluate earnings quality 4 Selected data from Tompkin Furniture, Inc., follows Selected balance sheet data Cash Marketable securities Accounts receivable, net Inventory Total current assets Long-term assets Total assets Accounts payable Short-term notes payable Total current liabilities Total long-term liabilities 2018 20172016 2015 S 2,800 3,000 $ 4,200 00600500 6,300 6,700 6,000 15,900 6,900 5,100 4,800 4,200 3,200 3,000 14,100 7,800 22,800 21,900 22,200 13,000 12 9,200 3,500 6,000 9,500 1,500 3,750 ,250 1,900 4,600 6,900 Selected income statement data Net sales revenue (ossume all sales are credit sales) Cost of goods sold 2018 20172016 2015 $34,500 $ 33,000$ 32,100 31,500 20,700 2,500 13,500 15,84014,445 Operating expenses Interest expense 13, 700 150 390 255


