Review In the questions in this assignment you'll do a regressional analysis and describe the relationship (if any) between the explanatory and response variables. While
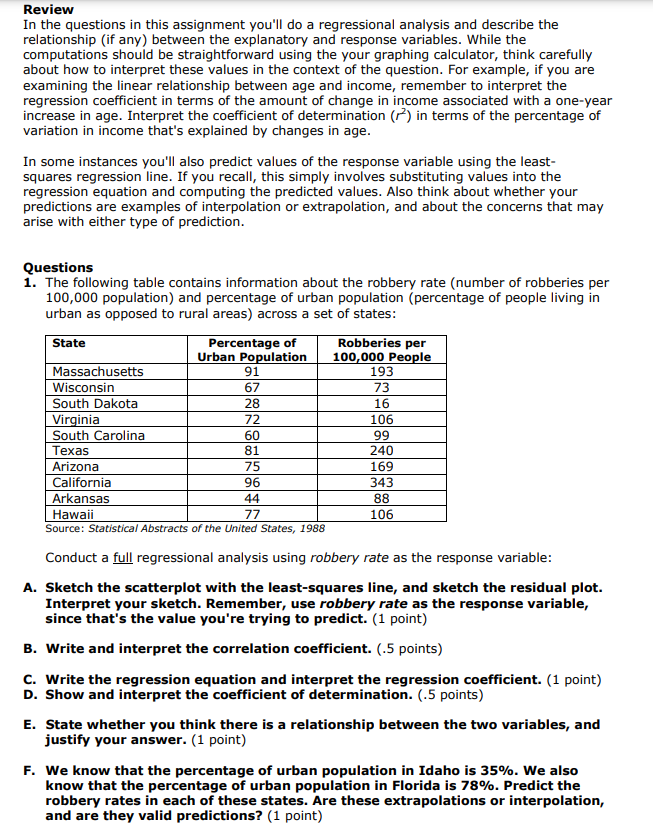
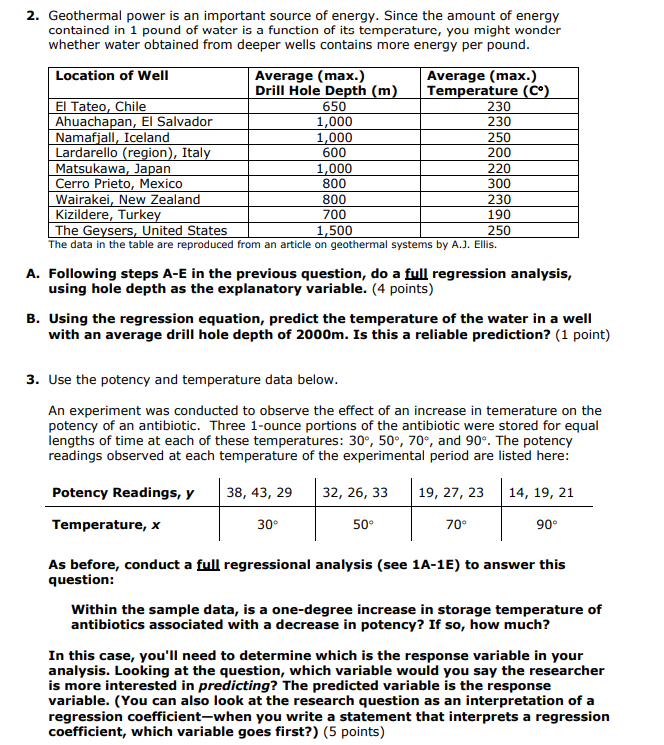
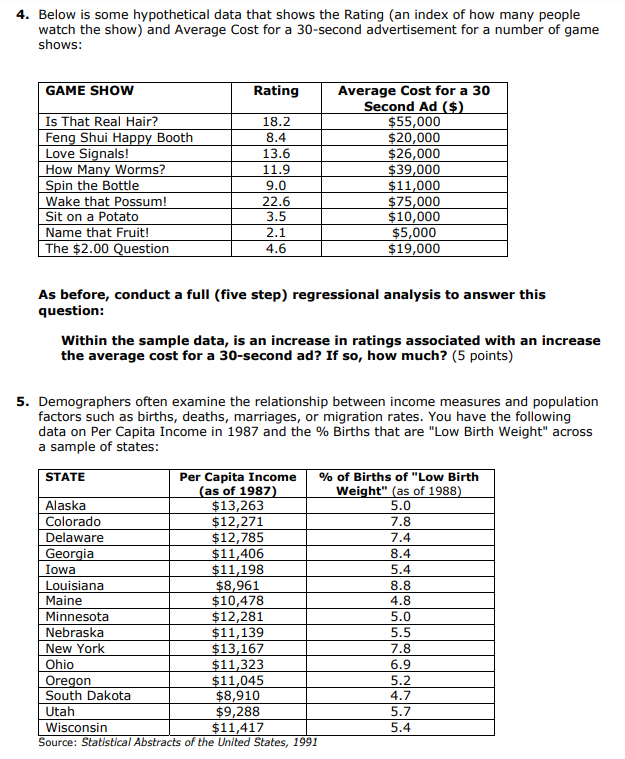
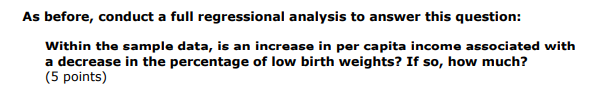
Review In the questions in this assignment you'll do a regressional analysis and describe the relationship (if any) between the explanatory and response variables. While the computations should be straightforward using the your graphing calculator, think carefully about how to interpret these values in the context of the question. For example, if you are examining the linear relationship between age and income, remember to interpret the regression coefficient in terms of the amount of change in income associated with a one-year increase in age. Interpret the coefficient of determination (%) in terms of the percentage of variation in income that's explained by changes in age. In some instances you'll also predict values of the response variable using the least- squares regression line. If you recall, this simply involves substituting values into the regression equation and computing the predicted values. Also think about whether your predictions are examples of interpolation or extrapolation, and about the concerns that may arise with either type of prediction. Questions 1. The following table contains information about the robbery rate {number of robberies per 100,000 population) and percentage of urban population (percentage of people living in urban as opposed to rural areas) across a set of states: Urban Population 100,000 People 106 | 106 (Arizona | 75 | @ 169 | | California | 9 | = 343 | [Arkansas | 44 @ | @ 88 | [ Hawaii | Source: Statistical Abstracts of the United States, 1988 South Dakota 28 | ' 72 91 28 72 H1 75 Virginia Conduct a full regressional analysis using robbery rate as the response variable: A. Sketch the scatterplot with the least-squares line, and sketch the residual plot. Interpret your sketch. Remember, use robbery rate as the response variable, since that's the value you're trying to predict. (1 point) B. Write and interpret the correlation coefficient. (.5 points) C. Write the regression equation and interpret the regression coefficient. (1 point) D. Show and interpret the coefficient of determination. (.5 points) E. State whether you think there is a relationship between the two variables, and justify your answer. (1 point) F. We know that the percentage of urban population in Idaho is 35%. We also know that the percentage of urban population in Florida is 78%. Predict the robbery rates in each of these states. Are these extrapolations or interpolation, and are they valid predictions? (1 point) 2. Geothermal power is an important source of energy. Since the amount of energy contained in 1 pound of water is a function of its temperature, you might wonder whether water obtained from deeper wells contains more energy per pound. Location of Well Average (max.) Average (max.) Drill Hole Depth (m Temperature (C El Tateo, Chile Ahuachapan, El Salvador 1,000 Namafjall, Iceland 1,000 The data in the table are reproduced from an article on geothermal systems by A.J. Ellis. A. Following steps A-E in the previous question, do a fyll regression analysis, using hole depth as the explanatory variable. (4 points) B. Using the regression equation, predict the temperature of the water in a well with an average drill hole depth of 2000m. Is this a reliable prediction? (1 point) 3. Use the potency and temperature data below. An experiment was conducted to observe the effect of an increase in temerature on the potency of an antibiotic. Three 1-ounce portions of the antibiotic were stored for equal lengths of time at each of these temperatures: 30, 50, 70%, and 90. The potency readings observed at each temperature of the experimental period are listed here: Potency Readings, y 38, 43, 29 32, 26, 33 19, 27, 23 14, 19, 21 Temperature, x 30* 50 70 aQ- As before, conduct a full regressional analysis (see 1A-1E) to answer this question: Within the sample data, is a one-degree increase in storage temperature of antibiotics associated with a decrease in potency? If so, how much? In this case, you'll need to determine which is the response variable in your analysis. Looking at the question, which variable would you say the researcher is more interested in predicting? The predicted variable is the response variable. (You can also look at the research question as an interpretation of a regression coefficientwhen you write a statement that interprets a regression coefficient, which variable goes first?) (5 points) 4. Below is some hypothetical data that shows the Rating (an index of how many people watch the show) and Average Cost for a 30-second advertisement for a number of game shows: Second Ad Is That Real Hair? 55,000 Feng Shui Happy Booth $20,000 $26,000 As before, conduct a full (five step) regressional analysis to answer this question: Within the sample data, is an increase in ratings associated with an increase the average cost for a 30-second ad? If so, how much? (5 points) 5. Demographers often examine the relationship between income measures and population factors such as births, deaths, marriages, or migration rates. You have the following data on Per Capita Income in 1987 and the % Births that are "Low Birth Weight" across a sample of states: as of 1987 Weight" (as of 1988 5.0 7.8 7.4 5.4 8.8 7.8 4.7 5.7 5.4 50 00000 | 78 000 | 74 00| 84 54 00000 | 88 00| | Maine | $10,478 48 00000 | 50 0000 | 55 00000 | 78 ] 69 00| 11,045 52 000 | 47 ] 57 0000 ] South Dakota 8,910 $9,288 $11,417 54 | Source: Statistical Abstracts of the United States, 199] As before, conduct a full regressional analysis to answer this question: Within the sample data, is an incraasea in per capita income associated with a decrease in the percentage of low birth weights? If so, how much? (5 points)
Step by Step Solution
There are 3 Steps involved in it
Step: 1
Get Instant Access to Expert-Tailored Solutions
See step-by-step solutions with expert insights and AI powered tools for academic success
Step: 2
Step: 3
Ace Your Homework with AI
Get the answers you need in no time with our AI-driven, step-by-step assistance