Review the attached financial statements for United Airlines
- Use ratio analysis and other forms of analyses like trend analysis to identify 2-3 financial opportunities or challenges. NOT macro things - review below
-
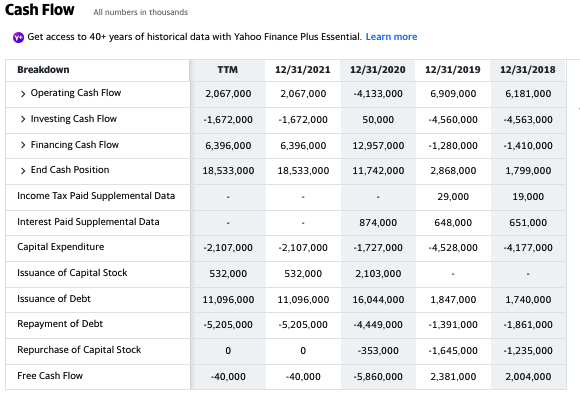
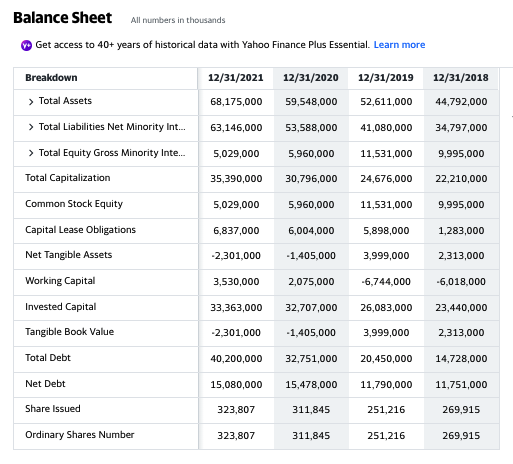
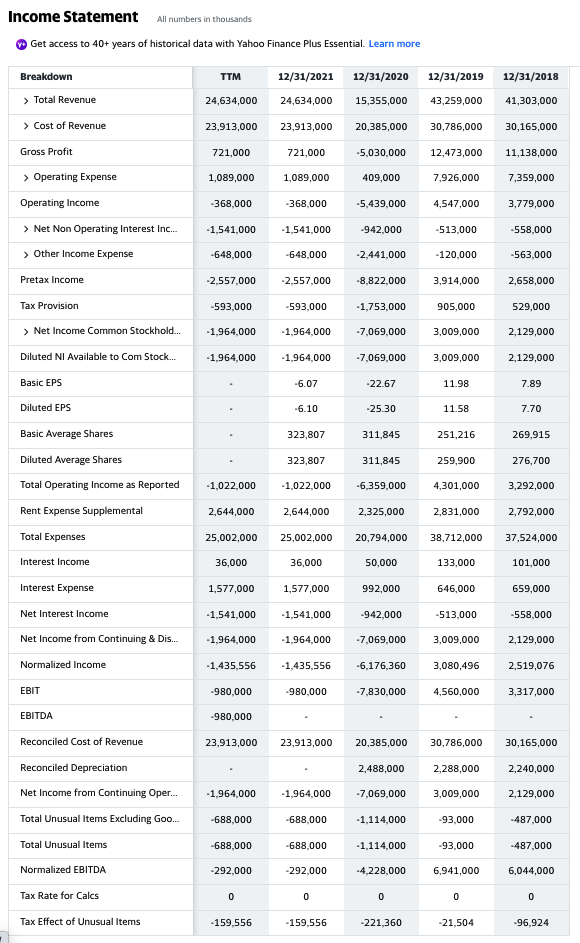
Cash Flow All numbers in thousands Get access to 40+ years of historical data with Yahoo Finance Plus Essential. Learn more TTM 12/31/2021 12/31/2020 12/31/2019 12/31/2018 2,067,000 2,067,000 -4,133,000 6,909,000 6,181,000 -1,672,000 -1,672,000 50,000 -4,560,000 -4,563,000 6,396,000 6,396,000 12,957,000 - 1,280,000 -1,410,000 18,533,000 18,533,000 11,742,000 2,868,000 1,799,000 29,000 19,000 Breakdown > Operating Cash Flow > Investing Cash Flow > Financing Cash Flow > End Cash Position Income Tax Paid Supplemental Data Interest Paid Supplemental Data Capital Expenditure Issuance of Capital Stock Issuance of Debt Repayment of Debt Repurchase of Capital Stock 874,000 648,000 651,000 -2,107.000 -2,107.000 -1,727,000 -4,528,000 -4,177,000 532,000 532,000 2,103,000 11,096,000 11,096,000 16,044,000 1,847,000 1,740,000 -5,205,000 -5,205,000 -4,449,000 -1,391,000 -1,861,000 0 0 -353,000 -1,645,000 -1,235,000 Free Cash Flow -40.000 -40,000 -5,860,000 2,381,000 2,004,000 Balance Sheet All numbers in thousands Get access to 40+ years of historical data with Yahoo Finance Plus Essential. Learn more 12/31/2021 12/31/2020 12/31/2019 12/31/2018 Breakdown > Total Assets 68,175,000 59,548,000 52,611,000 44,792,000 63,146,000 53,588,000 41,080,000 34,797,000 5,029,000 5,960,000 11,531,000 9,995,000 > Total Liabilities Net Minority Int... > Total Equity Gross Minority Inte... Total Capitalization Common Stock Equity Capital Lease Obligations 35,390,000 30,796,000 24,676,000 22,210,000 5,029,000 5,960,000 11,531,000 9,995,000 6,837,000 6,004,000 5,898,000 1,283,000 Net Tangible Assets -2.301,000 -1,405,000 3,999,000 2,313,000 3,530,000 2,075,000 -6,744,000 -6,018,000 33,363,000 32,707,000 26,083,000 23,440,000 Working Capital Invested Capital Tangible Book Value Total Debt -2,301,000 -1,405,000 3,999,000 2,313,000 40,200,000 32,751,000 20,450,000 14,728,000 Net Debt 15,080,000 15,478,000 11,790,000 11,751,000 Share issued 323,807 311,845 251,216 269,915 Ordinary Shares Number 323,807 311,845 251,216 269,915 All numbers in thousands Income Statement Get access to 40+ years of historical data with Yahoo Finance Plus Essential. Learn more 12/31/2021 12/31/2020 12/31/2019 12/31/2018 TTM 24,634,000 24,634,000 15,355,000 43,259,000 41,303,000 23,913,000 23,913,000 20,385,000 30,786,000 30,165,000 721,000 721,000 -5,030,000 12,473,000 11,138,000 1,089,000 1,089,000 409,000 7,926,000 7,359,000 -368,000 -368,000 -5,439,000 4,547,000 3,779,000 -1,541,000 -1,541,000 -942,000 -513,000 -558,000 Breakdown > Total Revenue > Cost of Revenue Gross Profit > Operating Expense Operating Income > Net Non Operating Interest Inc... > Other Income Expense Pretax Income Tax Provision > Net Income Common Stockhold... Diluted NI Available to Com Stock... Basic EPS Diluted EPS -648,000 -648,000 -2,441,000 -120,000 -563,000 -2,557,000 -2,557,000 -8,822,000 3,914,000 2,658,000 -593,000 -593,000 -1,753,000 905,000 529,000 -1,964,000 -1,964,000 -7,069,000 3,009,000 2,129,000 -1,964,000 -1,964,000 -7,069,000 3,009,000 2,129,000 -6.07 -22.67 11.98 7.89 -6.10 -25.30 11.58 7.70 323,807 311,845 251,216 269,915 323,807 311,845 259,900 276,700 Basic Average Shares Diluted Average Shares Total Operating Income as Reported Rent Expense Supplemental Total Expenses -1,022,000 -1,022,000 -6,359,000 4,301,000 3,292,000 2,644,000 2,644,000 2,325,000 2,831,000 2,792,000 25,002,000 25,002,000 20,794,000 38,712,000 37,524,000 Interest Income 36,000 36,000 50,000 133,000 101,000 Interest Expense 1,577,000 1,577,000 992,000 646,000 659,000 Net Interest Income -1,541,000 -1,541,000 -942,000 -513,000 -558,000 Net Income from Continuing & Dis... -1,964,000 -1.964,000 -7,069,000 3,009,000 2,129,000 Normalized Income -1.435,556 -1,435,556 -6,176,360 3,080,496 2,519,076 EBIT -980,000 -980,000 -7,830,000 4,560,000 3,317,000 EBITDA -980,000 Reconciled Cost of Revenue 23,913,000 23,913,000 20,385,000 30,786,000 30,165,000 2,488,000 2,288,000 2,240,000 Reconciled Depreciation Net Income from Continuing Oper... Total Unusual Items Excluding Go... -1,964,000 -1,964,000 -7,069,000 3,009,000 2,129,000 -688,000 -688,000 -1,114,000 -93,000 -487,000 Total Unusual Items -688,000 -688,000 -1,114,000 -93,000 -487,000 Normalized EBITDA -292,000 -292,000 -4,228,000 6,941,000 6,044,000 Tax Rate for Calcs 0 0 0 0 0 Tax Effect of Unusual Items -159.556 -159,556 -221,360 -21,504 -96,924