Review the attached images of the comprehensive annual financial report (CAFR). Indicate the activities accounted for in both internal service funds and major enterprise funds. Comment on whether any of these activities could also have been accounted for in a general or other governmental fund.
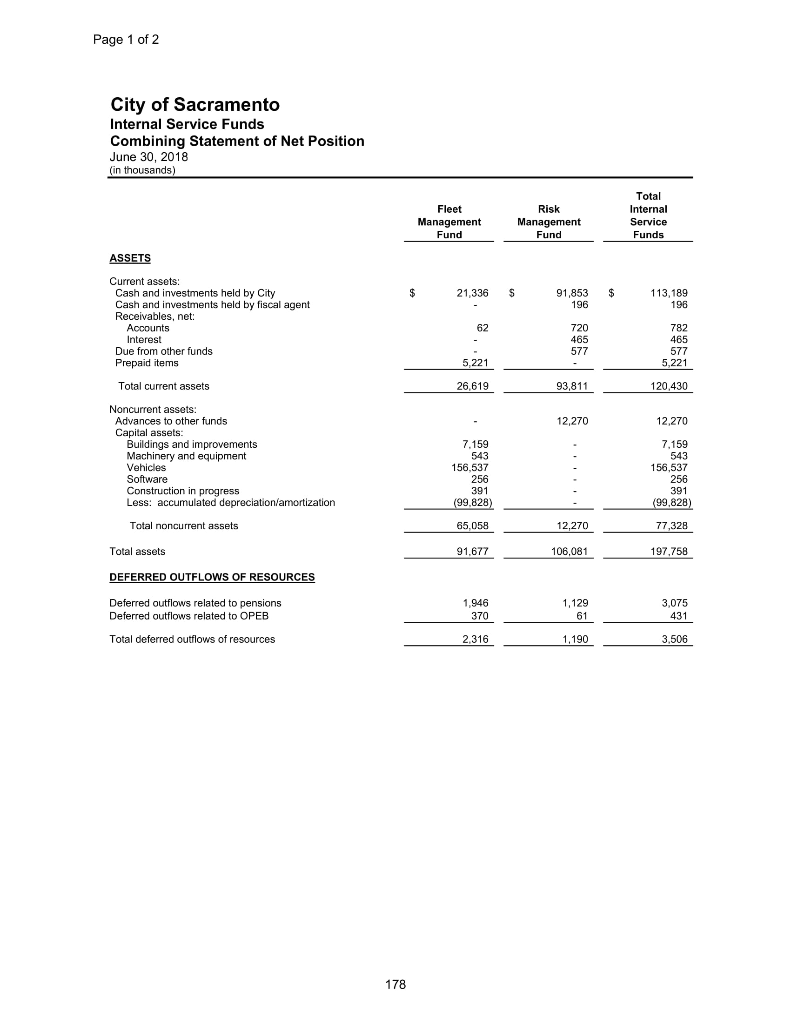
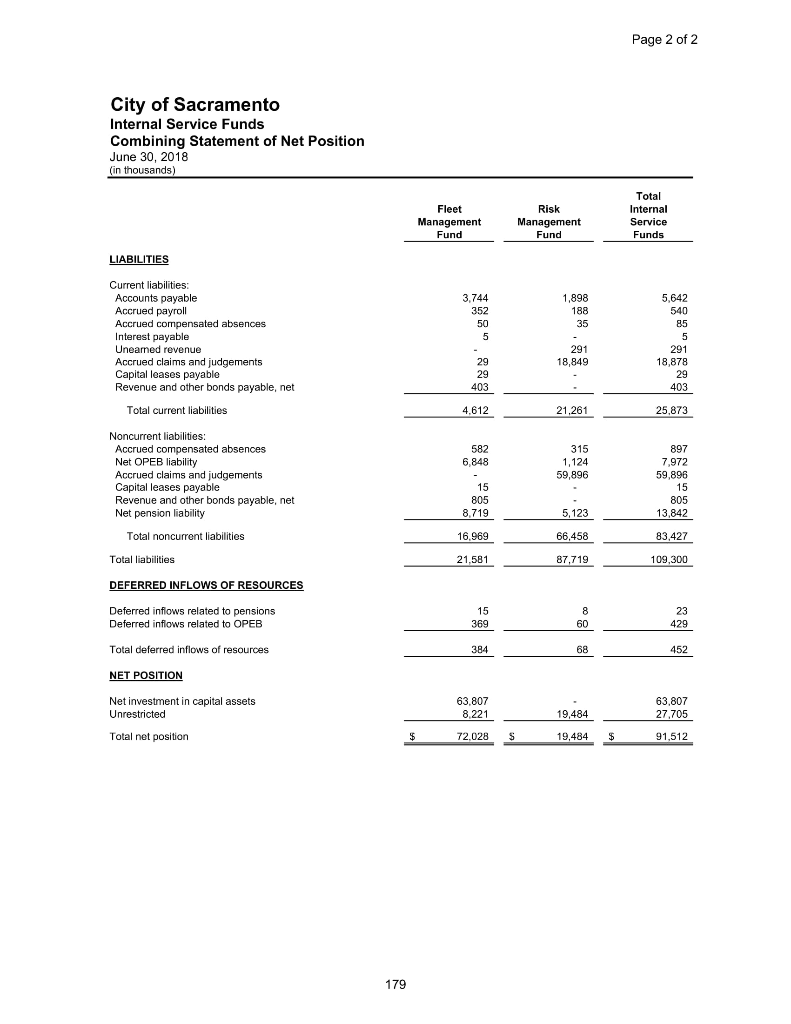
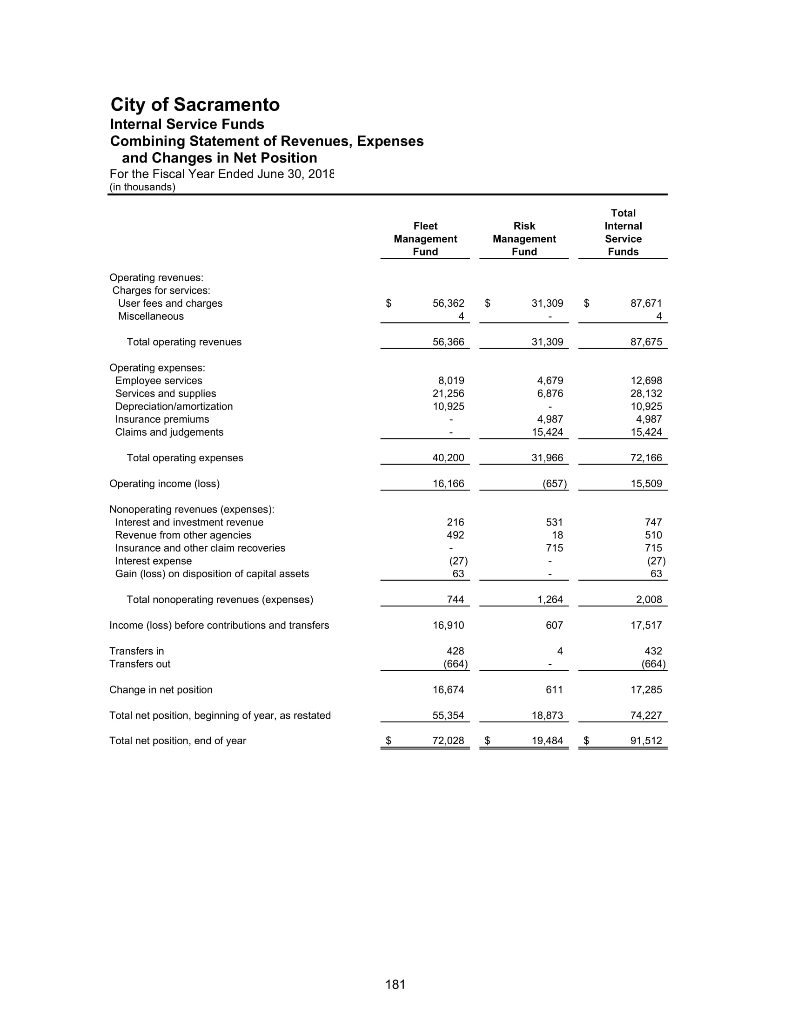
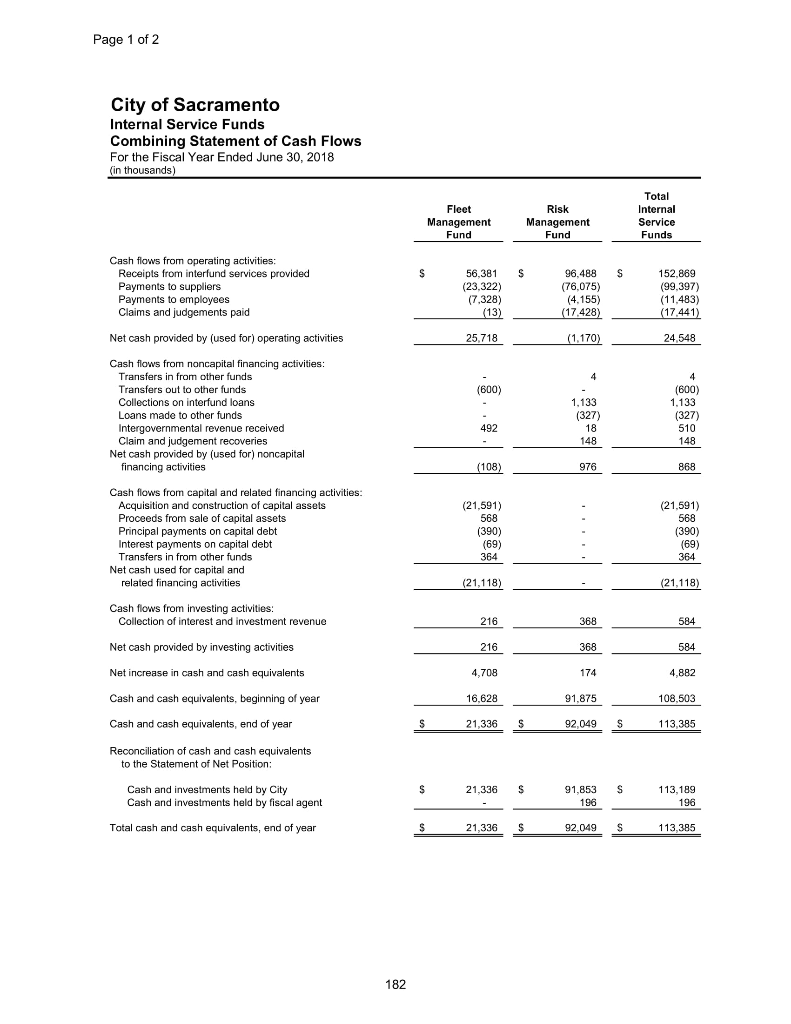
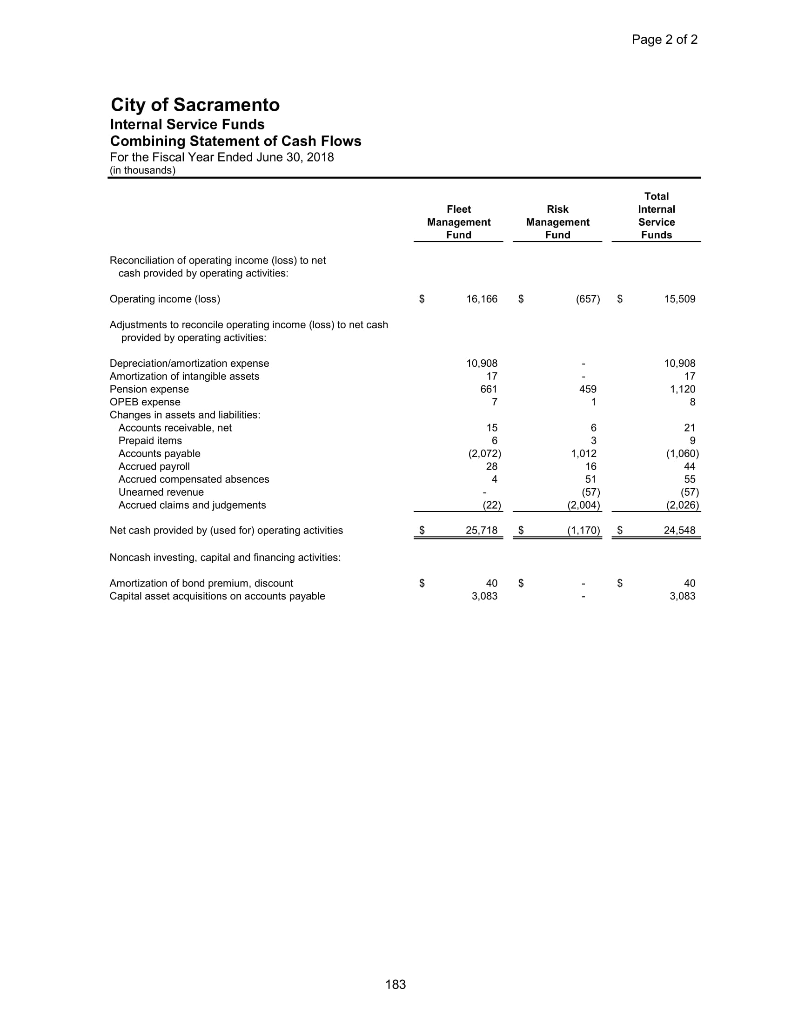
Page 1 of 2 City of Sacramento Internal Service Funds Combining Statement of Net Position June 30, 2018 (in thousands) Fleet Management Fund Risk Management Fund Total Internal Service Funds ASSETS $ 21,336 $ 91,853 196 $ 113,189 196 Current assets: Cash and investments held by City Cash and investments held by fiscal agent Receivables, net: Accounts Interest Due from other funds Prepaid items 62 720 465 577 782 465 577 5,221 5,221 Total current assets 26,619 93,811 120,430 12,270 12,270 Noncurrent assets: Advances to other funds Capital assets: Buildings and improvements Machinery and equipment Vehicles Software Construction in progress Less: accumulated depreciation/amortization 7.159 543 156,537 256 391 (99,828) 7.159 543 156,537 256 391 (99,828) Total noncurrent assets 65,058 12,270 77,328 Total assets 91.677 106,081 197,758 DEFERRED OUTFLOWS OF RESOURCES Deferred outflows related to pensions Deferred outflows related to OPEB 1,946 370 1,129 61 3.075 431 Total deferred outflows of resources 2.316 1,190 3,506 178 Page 2 of 2 City of Sacramento Internal Service Funds Combining Statement of Net Position June 30, 2018 (in thousands) Fleet Management Fund Risk Management Fund Total Internal Service Funds LIABILITIES 3,744 352 1,898 188 5,642 540 85 S 35 Current liabilities: Accounts payable Accrued payroll Accrued compensated absences Interest payable Unearned revenue Accrued claims and judgements Capital leases payable Revenue and other bonds payable, net 5 291 291 18,849 18,878 o 29 29 403 403 Total current liabilities 4,612 21.261 25,873 582 6,848 Noncurrent liabilities: Accrued compensated absences Net OPEB liability Accrued claims and judgements Capital leases payable Revenue and other bonds payable, net Net pension liability 315 1,124 59,896 897 7,972 59,896 15 805 13,842 15 805 8,719 5,123 Total noncurrent liabilities 83,427 16,969 21,581 66,458 87,719 Total liabilities 109,300 DEFERRED INFLOWS OF RESOURCES 23 Deferred inflows related to pensions Deferred inflows related to OPEB 15 369 429 Total deferred inflows of resources 384 452 NET POSITION 63,807 Net investment in capital assets Unrestricted 8.221 19,484 19,484 63,807 27.705 91,512 Total net position $ 72.028 $ $ 179 City of Sacramento Internal Service Funds Combining Statement of Revenues, Expenses and Changes in Net Position For the Fiscal Year Ended June 30, 2018 (in thousands) Fleet Management Fund Risk Management Fund Total Internal Service Funds Operating revenues: Charges for services: User fees and charges Miscellaneous 56,362 $ 31,309 $ 87,671 Total operating revenues 56,366 31,309 87,675 Operating expenses: Employee services Services and supplies Depreciation/amortization Insurance premiums Claims and judgements 8,019 21,256 10,925 4,679 6,876 12,698 28,132 10,925 4,987 15,424 4,987 15,424 Total operating expenses 40,200 31,966 72,166 Operating income (loss) 16,166 (657) 15,509 216 747 Nonoperating revenues (expenses): Interest and investment revenue Revenue from other agencies Insurance and other claim recoveries Interest expense Gain (loss) on disposition of capital assets 492 531 18 715 510 715 - (27) 63 (27) 63 Total nonoperating revenues (expenses) 744 2,008 1,264 607 Income (loss) before contributions and transfers 16,910 17,517 Transfers in Transfers out 428 (664) 432 (664) Change in net position 16,674 611 17,285 Total net position, beginning of year, as restated 55,354 74,227 18,873 19,484 Total net position, end of year 72,028 $ $ 91,512 181 Page 1 of 2 City of Sacramento Internal Service Funds Combining Statement of Cash Flows For the Fiscal Year Ended June 30, 2018 in thousands) Fleet Management Fund Risk Management Fund Total Internal Service Funds $ S Cash flows from operating activities: Receipts from interfund services provided Payments to suppliers Payments to employees Claims and judgements paid 56,381 (23,322) (7,328) (13) 96,488 (76,075) (4,155) (17.428) 152,869 (99,397) (11.483) (17.441) Net cash provided by (used for) operating activities 25,718 (1,170) 24,548 (600) Cash flows from noncapital financing activities: Transfers in from other funds Transfers out to other funds Collections on interfund loans Loans made to other funds Intergovernmental revenue received Claim and judgement recoveries Net cash provided by (used for) noncapital financing activities 1,133 (327) (600) 1.133 (327) 510 148 148 (108) 976 868 Cash flows from capital and related financing activities: Acquisition and construction of capital assets Proceeds from sale of capital assets Principal payments on capital debt Interest payments on capital debt Transfers in from other funds Net cash used for capital and related financing activities (21,591) 568 (390) (69) 364 (21,591) 568 (390) (69) 364 (21,118) (21,118) Cash flows from investing activities: Collection of interest and investment revenue 216 368 584 Net cash provided by investing activities 216 368 584 Net increase in cash and cash equivalents 4,708 174 4,882 Cash and cash equivalents, beginning of year 91,875 108,503 16,628 21,336 Cash and cash equivalents, end of year S 92,049 $ 113,385 Reconciliation of cash and cash equivalents to the Statement of Net Position: 21,336 $ S Cash and investments held by City Cash and investments held by fiscal agent 91,853 196 113, 189 196 Total cash and cash equivalents, end of year 21,336 $ 92,049 S 113,385 182 Page 2 of 2 City of Sacramento Internal Service Funds Combining Statement of Cash Flows For the Fiscal Year Ended June 30, 2018 in thousands) Fleet Management Fund Risk Management Fund Total Internal Service Funds Reconciliation of operating income (loss) to net cash provided by operating activities: Operating income (loss) S 16,166 $ (657) S 15.509 Adjustments to reconcile operating income (loss) to net cash provided by operating activities: 10.908 10.908 17 17 661 1,120 Depreciation/amortization expense Amortization of intangible assets Pension expense OPEB expense Changes in assets and liabilities: Accounts receivable, net Prepaid items Accounts payable Accrued payroll Accrued compensated absences Unearned revenue Accrued claims and judgements (2,072) 28 1,012 (1,060) 55 16 51 (57) (2,004) (22) (57) (2,026) Net cash provided by (used for) operating activities S 25.718 S (1.170) S 24,548 Noncash investing, capital and financing activities: S Amortization of bond premium, discount Capital asset acquisitions on accounts payable 40 3,083 - S 3,083 183 Page 1 of 2 City of Sacramento Internal Service Funds Combining Statement of Net Position June 30, 2018 (in thousands) Fleet Management Fund Risk Management Fund Total Internal Service Funds ASSETS $ 21,336 $ 91,853 196 $ 113,189 196 Current assets: Cash and investments held by City Cash and investments held by fiscal agent Receivables, net: Accounts Interest Due from other funds Prepaid items 62 720 465 577 782 465 577 5,221 5,221 Total current assets 26,619 93,811 120,430 12,270 12,270 Noncurrent assets: Advances to other funds Capital assets: Buildings and improvements Machinery and equipment Vehicles Software Construction in progress Less: accumulated depreciation/amortization 7.159 543 156,537 256 391 (99,828) 7.159 543 156,537 256 391 (99,828) Total noncurrent assets 65,058 12,270 77,328 Total assets 91.677 106,081 197,758 DEFERRED OUTFLOWS OF RESOURCES Deferred outflows related to pensions Deferred outflows related to OPEB 1,946 370 1,129 61 3.075 431 Total deferred outflows of resources 2.316 1,190 3,506 178 Page 2 of 2 City of Sacramento Internal Service Funds Combining Statement of Net Position June 30, 2018 (in thousands) Fleet Management Fund Risk Management Fund Total Internal Service Funds LIABILITIES 3,744 352 1,898 188 5,642 540 85 S 35 Current liabilities: Accounts payable Accrued payroll Accrued compensated absences Interest payable Unearned revenue Accrued claims and judgements Capital leases payable Revenue and other bonds payable, net 5 291 291 18,849 18,878 o 29 29 403 403 Total current liabilities 4,612 21.261 25,873 582 6,848 Noncurrent liabilities: Accrued compensated absences Net OPEB liability Accrued claims and judgements Capital leases payable Revenue and other bonds payable, net Net pension liability 315 1,124 59,896 897 7,972 59,896 15 805 13,842 15 805 8,719 5,123 Total noncurrent liabilities 83,427 16,969 21,581 66,458 87,719 Total liabilities 109,300 DEFERRED INFLOWS OF RESOURCES 23 Deferred inflows related to pensions Deferred inflows related to OPEB 15 369 429 Total deferred inflows of resources 384 452 NET POSITION 63,807 Net investment in capital assets Unrestricted 8.221 19,484 19,484 63,807 27.705 91,512 Total net position $ 72.028 $ $ 179 City of Sacramento Internal Service Funds Combining Statement of Revenues, Expenses and Changes in Net Position For the Fiscal Year Ended June 30, 2018 (in thousands) Fleet Management Fund Risk Management Fund Total Internal Service Funds Operating revenues: Charges for services: User fees and charges Miscellaneous 56,362 $ 31,309 $ 87,671 Total operating revenues 56,366 31,309 87,675 Operating expenses: Employee services Services and supplies Depreciation/amortization Insurance premiums Claims and judgements 8,019 21,256 10,925 4,679 6,876 12,698 28,132 10,925 4,987 15,424 4,987 15,424 Total operating expenses 40,200 31,966 72,166 Operating income (loss) 16,166 (657) 15,509 216 747 Nonoperating revenues (expenses): Interest and investment revenue Revenue from other agencies Insurance and other claim recoveries Interest expense Gain (loss) on disposition of capital assets 492 531 18 715 510 715 - (27) 63 (27) 63 Total nonoperating revenues (expenses) 744 2,008 1,264 607 Income (loss) before contributions and transfers 16,910 17,517 Transfers in Transfers out 428 (664) 432 (664) Change in net position 16,674 611 17,285 Total net position, beginning of year, as restated 55,354 74,227 18,873 19,484 Total net position, end of year 72,028 $ $ 91,512 181 Page 1 of 2 City of Sacramento Internal Service Funds Combining Statement of Cash Flows For the Fiscal Year Ended June 30, 2018 in thousands) Fleet Management Fund Risk Management Fund Total Internal Service Funds $ S Cash flows from operating activities: Receipts from interfund services provided Payments to suppliers Payments to employees Claims and judgements paid 56,381 (23,322) (7,328) (13) 96,488 (76,075) (4,155) (17.428) 152,869 (99,397) (11.483) (17.441) Net cash provided by (used for) operating activities 25,718 (1,170) 24,548 (600) Cash flows from noncapital financing activities: Transfers in from other funds Transfers out to other funds Collections on interfund loans Loans made to other funds Intergovernmental revenue received Claim and judgement recoveries Net cash provided by (used for) noncapital financing activities 1,133 (327) (600) 1.133 (327) 510 148 148 (108) 976 868 Cash flows from capital and related financing activities: Acquisition and construction of capital assets Proceeds from sale of capital assets Principal payments on capital debt Interest payments on capital debt Transfers in from other funds Net cash used for capital and related financing activities (21,591) 568 (390) (69) 364 (21,591) 568 (390) (69) 364 (21,118) (21,118) Cash flows from investing activities: Collection of interest and investment revenue 216 368 584 Net cash provided by investing activities 216 368 584 Net increase in cash and cash equivalents 4,708 174 4,882 Cash and cash equivalents, beginning of year 91,875 108,503 16,628 21,336 Cash and cash equivalents, end of year S 92,049 $ 113,385 Reconciliation of cash and cash equivalents to the Statement of Net Position: 21,336 $ S Cash and investments held by City Cash and investments held by fiscal agent 91,853 196 113, 189 196 Total cash and cash equivalents, end of year 21,336 $ 92,049 S 113,385 182 Page 2 of 2 City of Sacramento Internal Service Funds Combining Statement of Cash Flows For the Fiscal Year Ended June 30, 2018 in thousands) Fleet Management Fund Risk Management Fund Total Internal Service Funds Reconciliation of operating income (loss) to net cash provided by operating activities: Operating income (loss) S 16,166 $ (657) S 15.509 Adjustments to reconcile operating income (loss) to net cash provided by operating activities: 10.908 10.908 17 17 661 1,120 Depreciation/amortization expense Amortization of intangible assets Pension expense OPEB expense Changes in assets and liabilities: Accounts receivable, net Prepaid items Accounts payable Accrued payroll Accrued compensated absences Unearned revenue Accrued claims and judgements (2,072) 28 1,012 (1,060) 55 16 51 (57) (2,004) (22) (57) (2,026) Net cash provided by (used for) operating activities S 25.718 S (1.170) S 24,548 Noncash investing, capital and financing activities: S Amortization of bond premium, discount Capital asset acquisitions on accounts payable 40 3,083 - S 3,083 183


