Answered step by step
Verified Expert Solution
Link Copied!

Question

1 Approved Answer

Review the data provided in Table 1. For Acme Shoes and Brand X Shoes 1. Review the metrics to be calculated in Table 2. Review

Review the data provided in Table 1. For Acme Shoes and Brand X Shoes 1. Review the metrics to be calculated in Table 2. Review the course text book chapters and carry out research to identify the equations to calculate each metric. 2. Using the data from Table 1. Calculate each metric in Table 2. 3. Make sure to show the formulas and calculations step-by-step
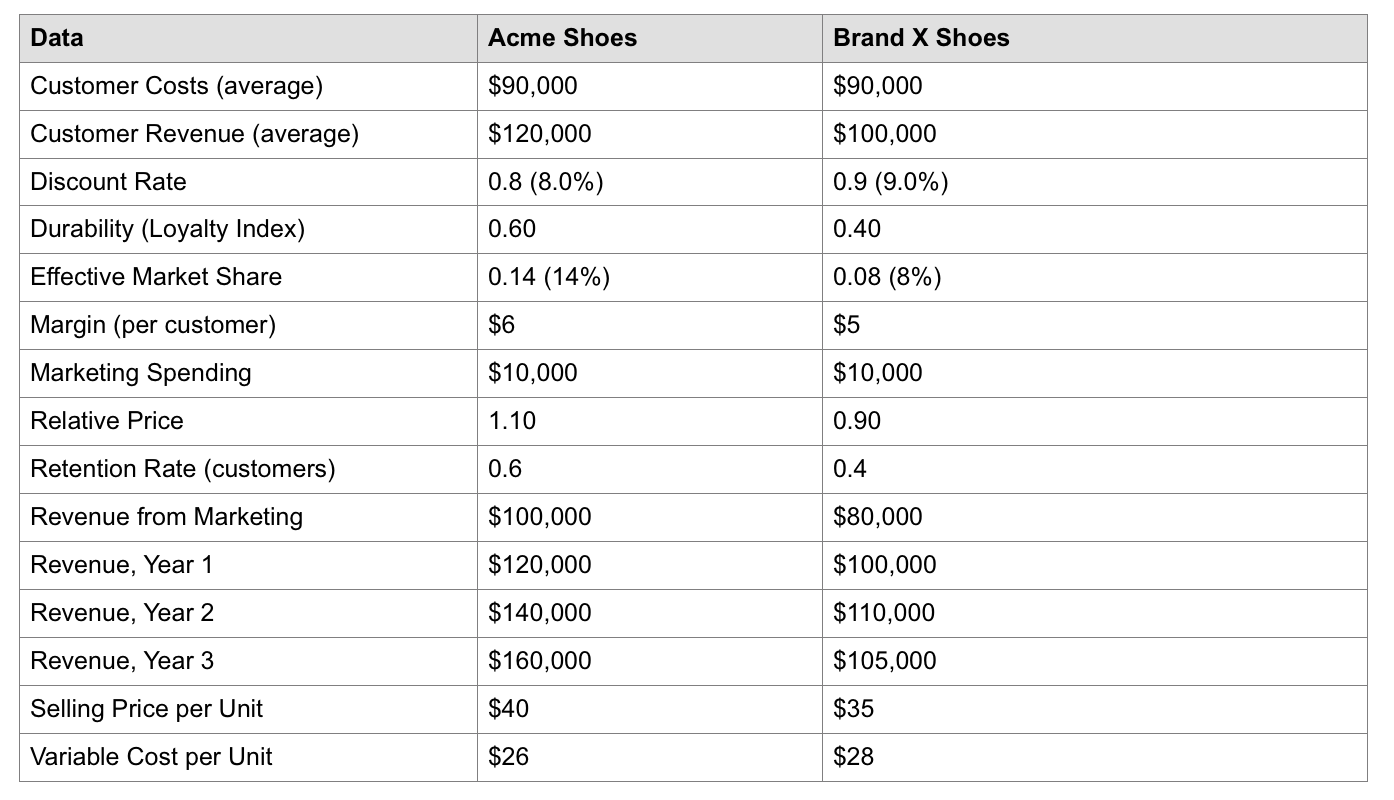
image text in transcribedimage text in transcribed

Data Acme Shoes Brand X Shoes $90,000 $120,000 Customer Costs (average) Customer Revenue (average) Discount Rate Durability (Loyalty Index) 0.8 (8.0%) 0.60 $90,000 $100,000 0.9 (9.0%) 0.40 0.08 (8%) Effective Market Share 0.14 (14%) $6 $5 $10,000 $10,000 0.90 1.10 0.4 Margin (per customer) Marketing Spending Relative Price Retention Rate (customers) Revenue from Marketing Revenue, Year 1 Revenue, Year 2 Revenue, Year 3 Selling Price per Unit Variable Cost per Unit 0.6 $100,000 $120,000 $140,000 $160,000 $80,000 $100,000 $110,000 $105,000 $35 $28 $40 $26 Strategic Metrics Acme Shoes Brand X Shoes Brand Equity Index Contribution Margin Ratio (%) Customer Lifetime Value Customer Profit (average) Revenue CAGR, Years 1 - 3 Revenue YOY Growth, Years 1 - 2 ROMI Data Acme Shoes Brand X Shoes $90,000 $120,000 Customer Costs (average) Customer Revenue (average) Discount Rate Durability (Loyalty Index) 0.8 (8.0%) 0.60 $90,000 $100,000 0.9 (9.0%) 0.40 0.08 (8%) Effective Market Share 0.14 (14%) $6 $5 $10,000 $10,000 0.90 1.10 0.4 Margin (per customer) Marketing Spending Relative Price Retention Rate (customers) Revenue from Marketing Revenue, Year 1 Revenue, Year 2 Revenue, Year 3 Selling Price per Unit Variable Cost per Unit 0.6 $100,000 $120,000 $140,000 $160,000 $80,000 $100,000 $110,000 $105,000 $35 $28 $40 $26 Strategic Metrics Acme Shoes Brand X Shoes Brand Equity Index Contribution Margin Ratio (%) Customer Lifetime Value Customer Profit (average) Revenue CAGR, Years 1 - 3 Revenue YOY Growth, Years 1 - 2 ROMI

Step by Step Solution

There are 3 Steps involved in it

Step: 1

blur-text-image

Get Instant Access to Expert-Tailored Solutions

See step-by-step solutions with expert insights and AI powered tools for academic success

Step: 2

blur-text-image

Step: 3

blur-text-image

Ace Your Homework with AI

Get the answers you need in no time with our AI-driven, step-by-step assistance

Get Started

Recommended Textbook for

Personal Finance

Authors: Jeff Madura

5th edition

132994348, 978-0132994347

More Books

Students also viewed these Finance questions