-
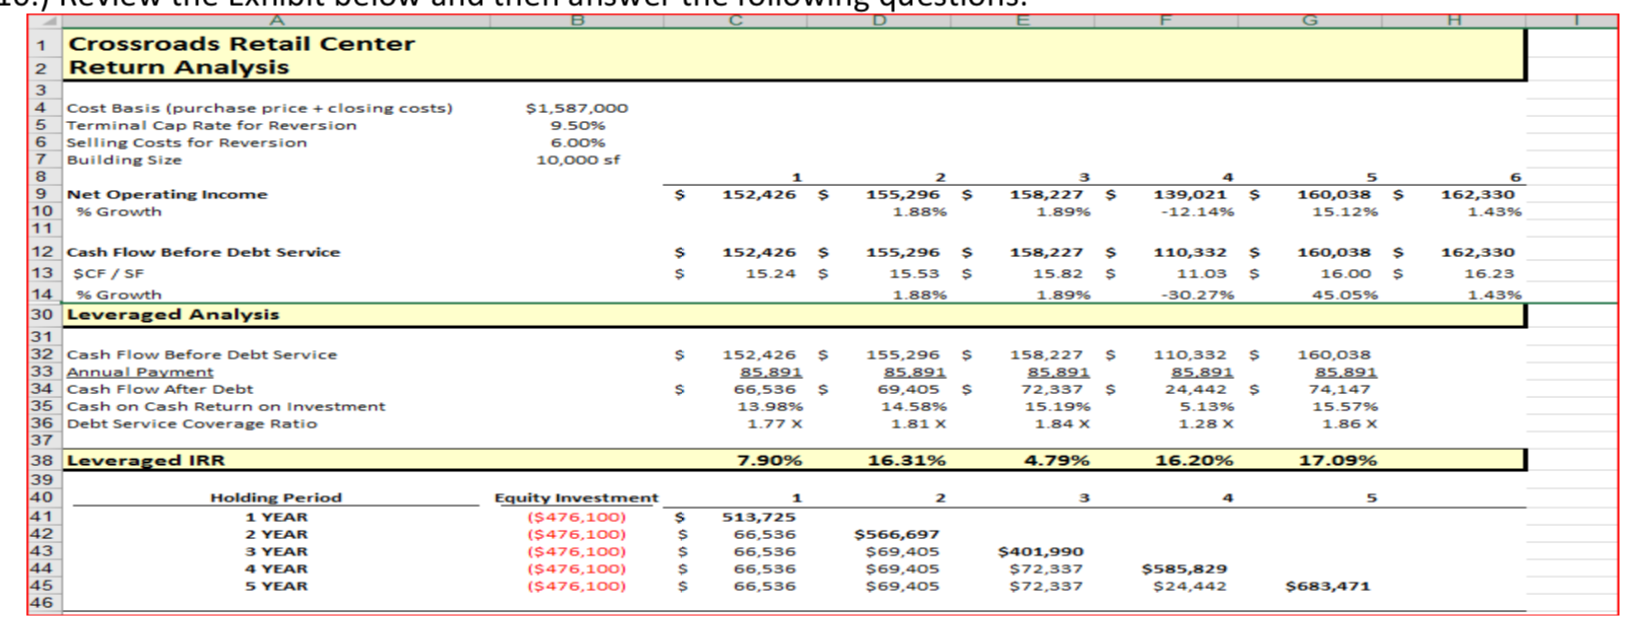
Review the Exhibit below and then answer the following questions.
-
a.) What year is the optimal time to sell the above asset? Why?
-
b.) Explain why the decision should NOT be based on the highest IRR.
-
c.) The CEO of your company approaches you and asks, Should we refinance? and hands you a
loan term sheet with the following terms: $1.2MM loan, 4.5% interest rate, no pre-payment
penalty, 6-year term, 25-year amortization. Do you recommend selling or to refinance? Please
explain in three paragraphs or less. Report the new equity balance if this refinance occurs.
B E G $1,587,000 9.5096 6.0096 10,000 sf 1 152,426 5 2 155,296 5 1.8896 3 158,227 5 1.89% 4 139,021 s -12.1496 5 160,038 $ 15.12% 6 162,330 1.4396 Crossroads Retail Center 2 Return Analysis 3 Cost Basis (purchase price + closing costs) 5 Terminal Cap Rate for Reversion 6 Selling Costs for Reversion 7 Building Size 8 9 Net Operating Income 10 % Growth 11 12 Cash Flow Before Debt Service 13 SCF / SF 14 % Growth 30 Leveraged Analysis 31 32 Cash Flow Before Debt Service 33 Annual Payment 34 Cash Flow After Debt 35 Cash on Cash Return on Investment 36 Debt Service Coverage Ratio 37 38 Leveraged IRR $ 152,426 5 15.24 5 155,296 15.53 1.8896 $ $ $ 158,227 S 15.82 $ 1.8996 110,332 S 11.03 s -30.27% 160,038 16.00 $ 45.05% 162,330 16.23 1.4396 $ s 152,426 s 85,891 66,536 5 13.9896 1.77 x 155,296 $ 85,891 69,405 $ 14.5896 1.81 x 158,227 5 85,891 72,337 $ 15.1996 1.84 X 110,332 5 85.891 24,442 5 5.1396 1.28 X 160,038 85,891 74,147 15.57% 1.86 X 7.90% 16.31% 4.79% 16.20% 17.09% 39 1 2 3 4 5 40 41 42 143 44 45 46 Holding Period 1 YEAR 2 YEAR 3 YEAR 4 YEAR 5 YEAR Equity Investment ($476,100) ($476,100) ($476,100) ($ 476,100) ($ 476,100) $ $ $ $ $ 513,725 66,536 66,536 66,536 66,536 $566,697 $69,405 $69,405 $69,405 $401,990 $72,337 $72,337 $585,829 $24,442 $683,471 B E G $1,587,000 9.5096 6.0096 10,000 sf 1 152,426 5 2 155,296 5 1.8896 3 158,227 5 1.89% 4 139,021 s -12.1496 5 160,038 $ 15.12% 6 162,330 1.4396 Crossroads Retail Center 2 Return Analysis 3 Cost Basis (purchase price + closing costs) 5 Terminal Cap Rate for Reversion 6 Selling Costs for Reversion 7 Building Size 8 9 Net Operating Income 10 % Growth 11 12 Cash Flow Before Debt Service 13 SCF / SF 14 % Growth 30 Leveraged Analysis 31 32 Cash Flow Before Debt Service 33 Annual Payment 34 Cash Flow After Debt 35 Cash on Cash Return on Investment 36 Debt Service Coverage Ratio 37 38 Leveraged IRR $ 152,426 5 15.24 5 155,296 15.53 1.8896 $ $ $ 158,227 S 15.82 $ 1.8996 110,332 S 11.03 s -30.27% 160,038 16.00 $ 45.05% 162,330 16.23 1.4396 $ s 152,426 s 85,891 66,536 5 13.9896 1.77 x 155,296 $ 85,891 69,405 $ 14.5896 1.81 x 158,227 5 85,891 72,337 $ 15.1996 1.84 X 110,332 5 85.891 24,442 5 5.1396 1.28 X 160,038 85,891 74,147 15.57% 1.86 X 7.90% 16.31% 4.79% 16.20% 17.09% 39 1 2 3 4 5 40 41 42 143 44 45 46 Holding Period 1 YEAR 2 YEAR 3 YEAR 4 YEAR 5 YEAR Equity Investment ($476,100) ($476,100) ($476,100) ($ 476,100) ($ 476,100) $ $ $ $ $ 513,725 66,536 66,536 66,536 66,536 $566,697 $69,405 $69,405 $69,405 $401,990 $72,337 $72,337 $585,829 $24,442 $683,471