

Question
Review the Sales Forecast below and the Excel Sales Forecast. Then critically analyze them both. Please give the analysis! Sales Forecast Secondary research has determined
Review the "Sales Forecast" below and the "Excel Sales Forecast". Then critically analyze them both. Please give the analysis!
Sales Forecast
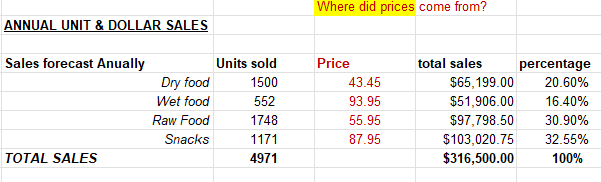
Secondary research has determined monthly sales for Urban Woof to follow a trend of monthly pet food sales in Canada. According to Statista, there is a trend that pet food sales have every year (see Appendix P). Using this data, we have estimated how many sales per unit our start-up company will have within the first 12 months. Also, Stats Canada shows the average dollar revenue per year of low quartile shops (StatsCan, 2019).
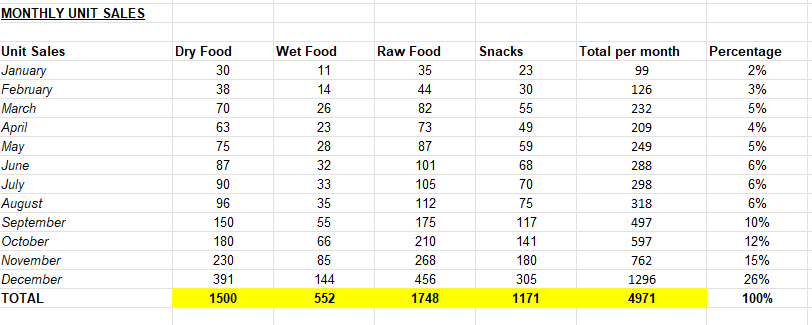
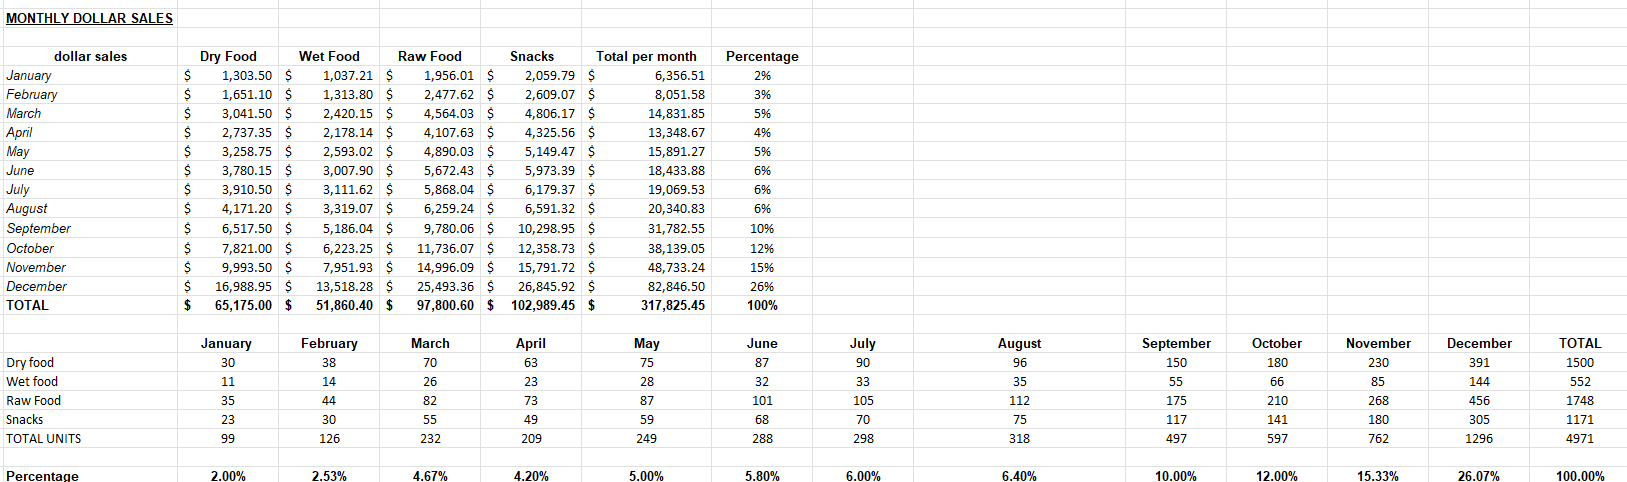
We have computed our yearly estimated sales in units and our monthly dollar sales. Our total annual estimated unit sales are 4971 units which equals $316,500 (see Appendix Q). However, our monthly total dollar sales have equaled $317,825 (see Appendix Q). We assume this slight deviation is due to rounded up dollars and cents from calculations.
Pricing is based on brands that we have URBAN WOOF: PREMIUM NATURAL DOG FOOD 9 decided to carry. Since pricing is highly competitive, our stores pricing is similar to that as of True Carnivores (True Carnivores, 2020).
We forecast monthly sales to start slow in January considering that is the month we open, slow sales in February, and for sales to begin ramping up as brand awareness grows. Sales remain consistent until September, and then jump considerably towards the end of year in December (see Appendix P):
January - $6,356
February - $8,051
March - $14,831
April - $13,348
May - $15,891
June - $18,433
July - $19,069
August - $20,340
September - $31,782
October - $38,139
November - $48,733
December - $82,846
Excel Sales Forecast
Step by Step Solution
There are 3 Steps involved in it
Step: 1

Get Instant Access to Expert-Tailored Solutions
See step-by-step solutions with expert insights and AI powered tools for academic success
Step: 2

Step: 3
Ace Your Homework with AI
Get the answers you need in no time with our AI-driven, step-by-step assistance
Get Started
Tax Audit Guidelines For The State Of California Employment Development Department
Authors: State Of California, Employment Development Department
1st Edition
B0C1J7KT6R, 979-8390634066