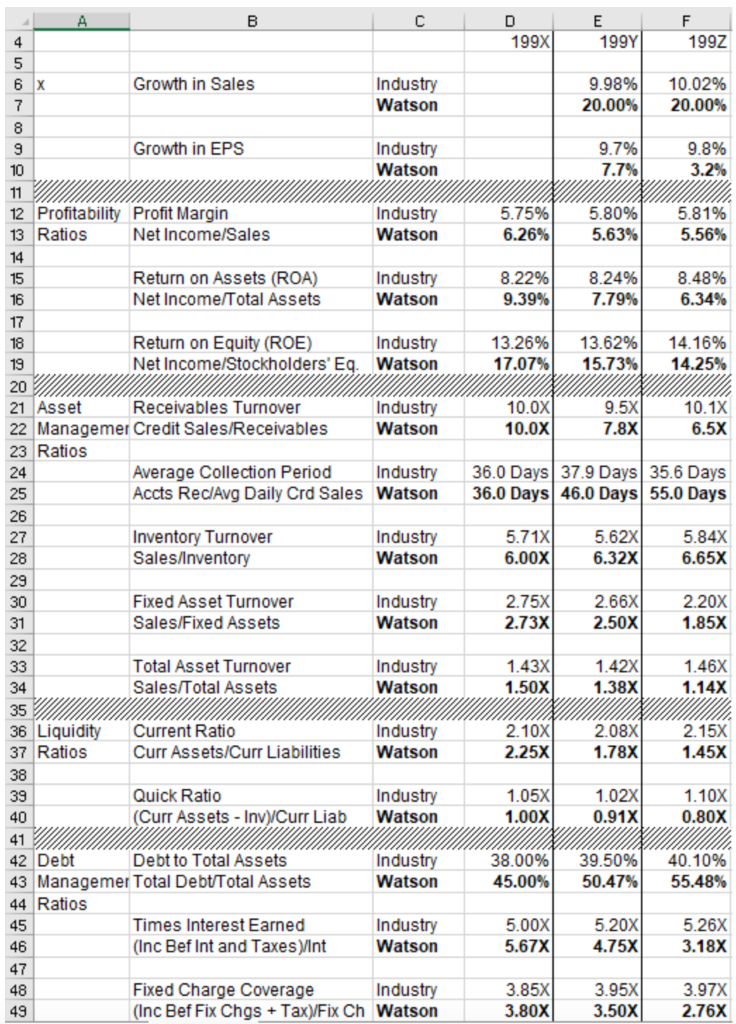
Review the Watson case using the following financial ratios in a trend analysis. Note that year 199x =1997, y=1998, and z = 1999. While sales growth is strong, this firm has some issues. Can you identify them? Recommend solutions?

1993 1994 1992 Growth in Sales Industry Watson 9.98% 20.00% 10.02% 20.00% Growth in EPS Industry Watson 9.7% 7.7% 9.8% 3.2% Industry 12 Profitability Profit Margin 13 Ratios Net Income/Sales 5.75% 6.26% 5.80% 5.63% Watson 5.81% 5.56% Return on Assets (ROA) Net Income Total Assets Industry Watson 8.22% 9.39% 8.24% 7.79% 8.48% 6.34% Return on Equity (ROE) Industry Net Income/Stockholders' Eq. Watson 13.26% 17.07% 13.62% 15.73% 14.16% 14.25% 9.5X 10.1X 10.0x| 10.0x 6.5X 21 Asset Receivables Turnover Industry 22 Managemer Credit Sales/Receivables Watson 23 Ratios Average Collection Period Industry Accts Rec/Avg Daily Crd Sales Watson 36.0 Days 37.9 Days 35.6 Days 36.0 Days 46.0 Days 55.0 Days Inventory Turnover Sales/Inventory Industry Watson 5.71x| 6.00 5.62x 6.32x 5.84X 6.65X Fixed Asset Turnover Sales/Fixed Assets Industry Watson 2.75x1 2.73x| 2.66% 2.50xl 2.20x 1.85X Total Asset Turnover Sales/Total Assets Industry Watson 1.43x 1.50X 1.42x/ 1.38X 1.46x 1.14X 36 Liquidity 37 Ratios Current Ratio Curr Assets/Curr Liabilities Industry Watson 2.10X 2.25x| 2.08X 1.78X 2.15X 1.45X 39 Quick Ratio (Curr Assets - Inv)/Curr Liab Industry Watson 1.05X 1.00X 1.02X 0.91X 1.10X 0.80x Industry Watson 38.00% 45.00% 39.50% 50.47% 40.10% 55.48% 42 Debt Debt to Total Assets 43 Managemer Total Debt Total Assets 44 Ratios Times Interest Earned (Inc Bef Int and Taxes Vint Industry Watson 5.00x| 5.67X 5.20x| 4.75x 5.26% 3.18X Fixed Charge Coverage Industry (Inc Bef Fix Chgs + Tax)/Fix Ch Watson 3.85x| 3.80X 3.95X| 3.50x 3.97X 2.76X 1993 1994 1992 Growth in Sales Industry Watson 9.98% 20.00% 10.02% 20.00% Growth in EPS Industry Watson 9.7% 7.7% 9.8% 3.2% Industry 12 Profitability Profit Margin 13 Ratios Net Income/Sales 5.75% 6.26% 5.80% 5.63% Watson 5.81% 5.56% Return on Assets (ROA) Net Income Total Assets Industry Watson 8.22% 9.39% 8.24% 7.79% 8.48% 6.34% Return on Equity (ROE) Industry Net Income/Stockholders' Eq. Watson 13.26% 17.07% 13.62% 15.73% 14.16% 14.25% 9.5X 10.1X 10.0x| 10.0x 6.5X 21 Asset Receivables Turnover Industry 22 Managemer Credit Sales/Receivables Watson 23 Ratios Average Collection Period Industry Accts Rec/Avg Daily Crd Sales Watson 36.0 Days 37.9 Days 35.6 Days 36.0 Days 46.0 Days 55.0 Days Inventory Turnover Sales/Inventory Industry Watson 5.71x| 6.00 5.62x 6.32x 5.84X 6.65X Fixed Asset Turnover Sales/Fixed Assets Industry Watson 2.75x1 2.73x| 2.66% 2.50xl 2.20x 1.85X Total Asset Turnover Sales/Total Assets Industry Watson 1.43x 1.50X 1.42x/ 1.38X 1.46x 1.14X 36 Liquidity 37 Ratios Current Ratio Curr Assets/Curr Liabilities Industry Watson 2.10X 2.25x| 2.08X 1.78X 2.15X 1.45X 39 Quick Ratio (Curr Assets - Inv)/Curr Liab Industry Watson 1.05X 1.00X 1.02X 0.91X 1.10X 0.80x Industry Watson 38.00% 45.00% 39.50% 50.47% 40.10% 55.48% 42 Debt Debt to Total Assets 43 Managemer Total Debt Total Assets 44 Ratios Times Interest Earned (Inc Bef Int and Taxes Vint Industry Watson 5.00x| 5.67X 5.20x| 4.75x 5.26% 3.18X Fixed Charge Coverage Industry (Inc Bef Fix Chgs + Tax)/Fix Ch Watson 3.85x| 3.80X 3.95X| 3.50x 3.97X 2.76X


