

Question
Rewrite the following MATLAB script with regards to the Gait Analysis provided to calculate and plot the knee joint angle for a complete gait cycle
Rewrite the following MATLAB script with regards to the Gait Analysis provided to calculate and plot the knee joint angle for a complete gait cycle (heel strike to heel strike). In order to accomplish this, create a MATLAB function to read the .csv file and pass the contents obtained in a "structure" to the main script. You must eliminate the "for loop" with an appropriate "operator". Then, calculate the joint angle from the segment angles and plot over the appropriate scale. The .csv file is also PROVIDED BELOW.
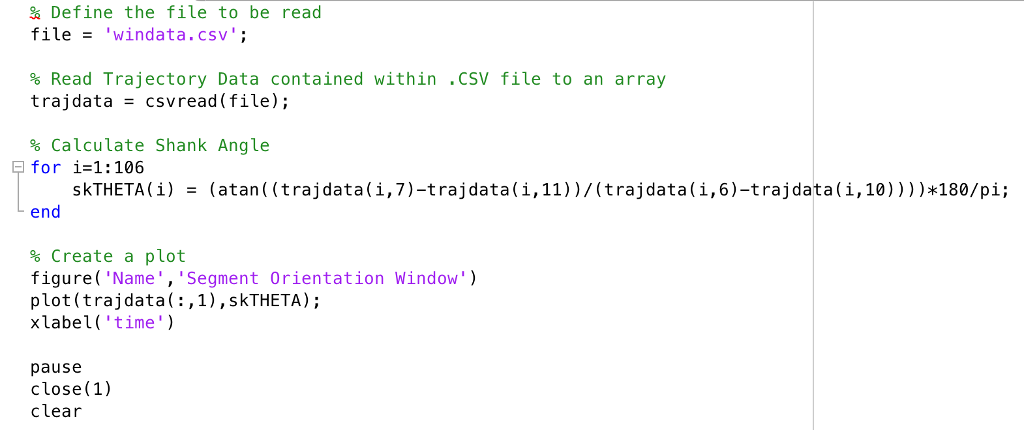
Figure 1 (above): GaitCycleAnalysis Script
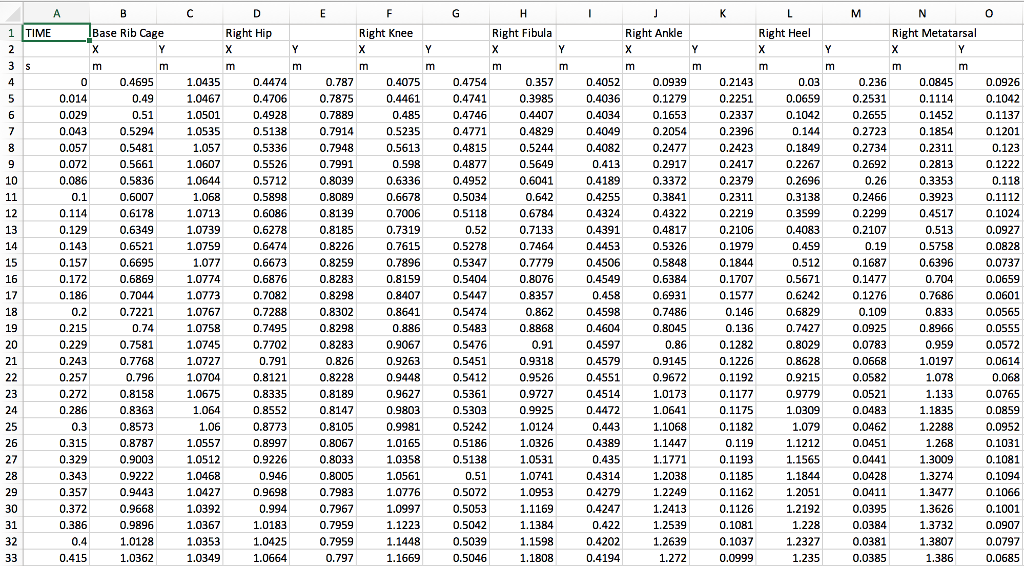
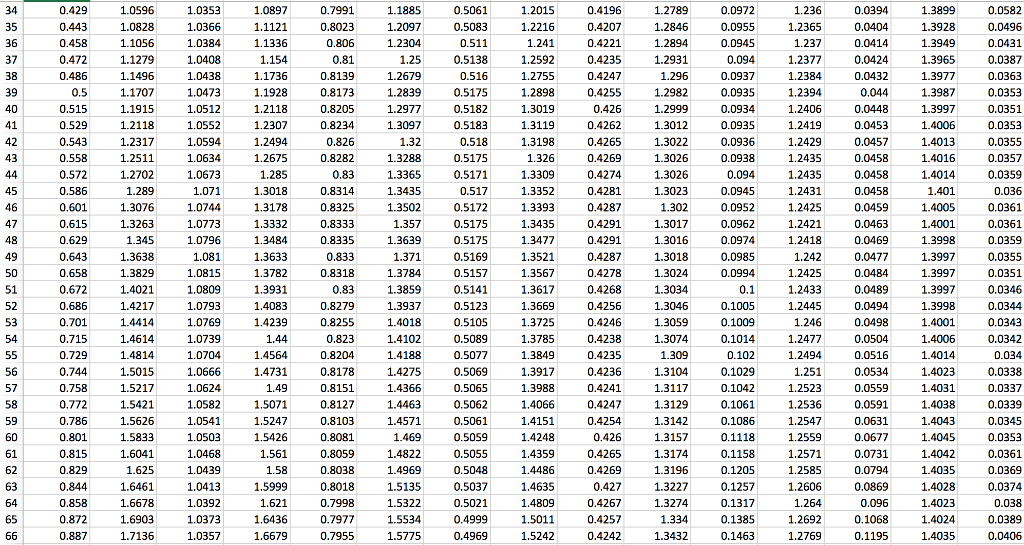
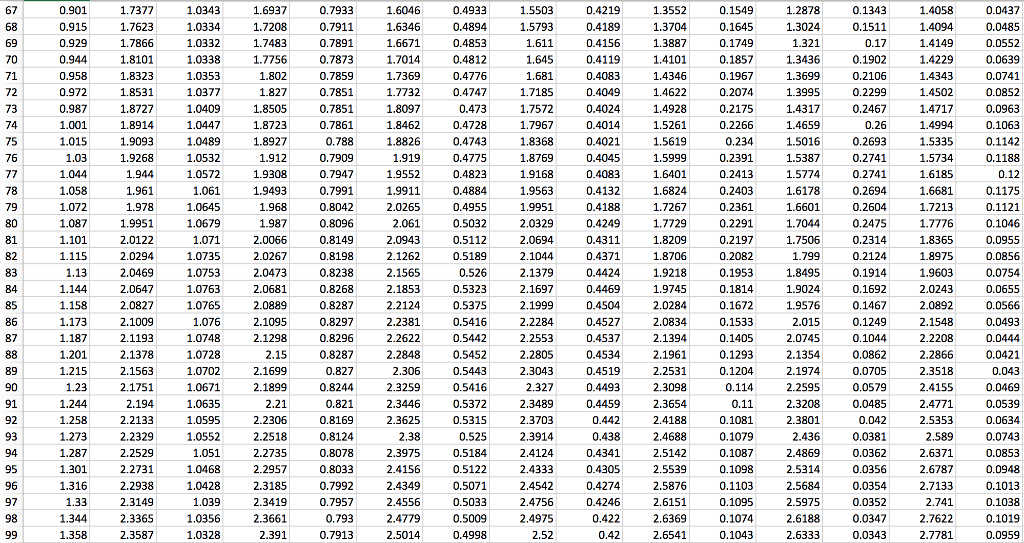
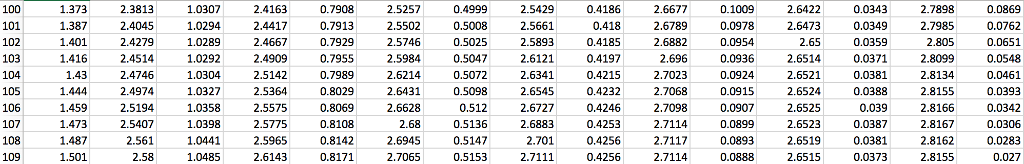
Figure 2 (above): Complete windata.csv data
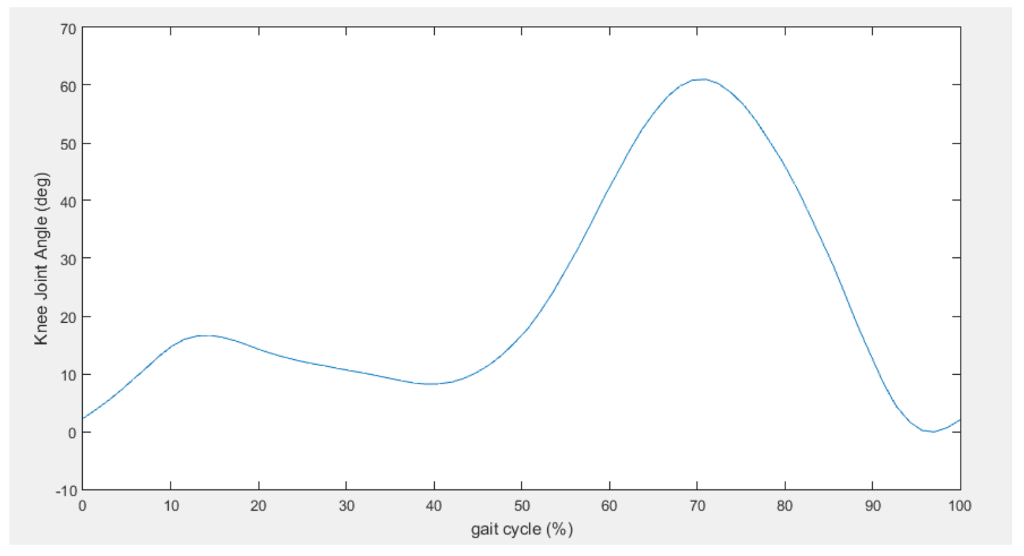
Figure 3 (above): A Plot of what the script should produce
To calculate the angle, use the equation (transcribed in the script) as:
skTHETA = (atan((trajdata(:,7)-trajdata(:,11))./(trajdata(:,6)-trajdata(:,10))))*180/pi; skTHETA(skTHETA
CSV FILE: https://www.dropbox.com/s/tok2a3c6mvv9mry/windata.csv?dl=0
Define the file to be read file'windata.csv' % Read Trajectory Data contained within "CSV file to an array trajdata -csvread(file); % Calculate Shank Angle for i-1: 106 skTHETA ( ) (atan((traj data(,7)-traj data(i,11) ) / ( traj data(i,6)-traj data(i,10))))*180/pi; end % Create a plot figure( 'Name, 'Segment Orientation Window') plot (trajdata(:,1), skTHETA); xlabel ('time' pause close(1) clear Define the file to be read file'windata.csv' % Read Trajectory Data contained within "CSV file to an array trajdata -csvread(file); % Calculate Shank Angle for i-1: 106 skTHETA ( ) (atan((traj data(,7)-traj data(i,11) ) / ( traj data(i,6)-traj data(i,10))))*180/pi; end % Create a plot figure( 'Name, 'Segment Orientation Window') plot (trajdata(:,1), skTHETA); xlabel ('time' pause close(1) clearStep by Step Solution
There are 3 Steps involved in it
Step: 1

Get Instant Access to Expert-Tailored Solutions
See step-by-step solutions with expert insights and AI powered tools for academic success
Step: 2

Step: 3
Ace Your Homework with AI
Get the answers you need in no time with our AI-driven, step-by-step assistance
Get Started
Spatial Databases A Tour
Authors: Shashi Shekhar, Sanjay Chawla
1st Edition
0130174807, 978-0130174802