

Question
rior to a new drive through system the mean wait time at a certain fast food restaurant was 99 seconds Ise the data in the
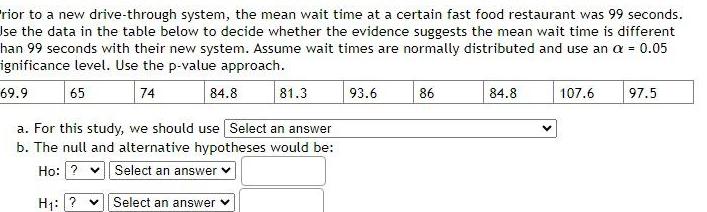

rior to a new drive through system the mean wait time at a certain fast food restaurant was 99 seconds Ise the data in the table below to decide whether the evidence suggests the mean wait time is different han 99 seconds with their new system Assume wait times are normally distributed and use an a 0 05 ignificance level Use the p value approach 69 9 65 74 81 3 a For this study we should use Select an answer b The null and alternative hypotheses would be Ho Select an answer H Select an answer 84 8 93 6 86 84 8 107 6 97 5
Step by Step Solution
There are 3 Steps involved in it
Step: 1

Get Instant Access to Expert-Tailored Solutions
See step-by-step solutions with expert insights and AI powered tools for academic success
Step: 2

Step: 3
Ace Your Homework with AI
Get the answers you need in no time with our AI-driven, step-by-step assistance
Get Started
CAD/CAM Systems Planning And Implementation
Authors: Charles S Knox
1st Edition
1000146383, 9781000146387