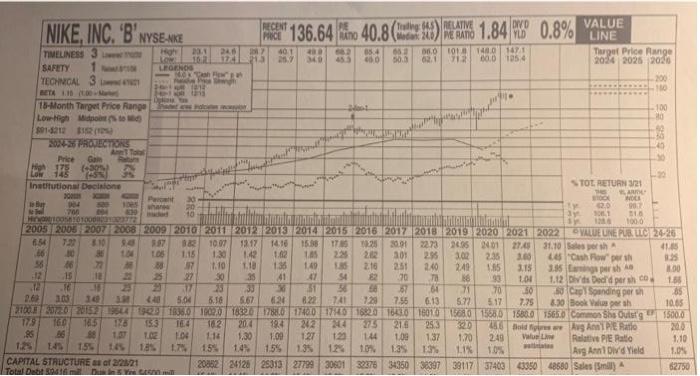
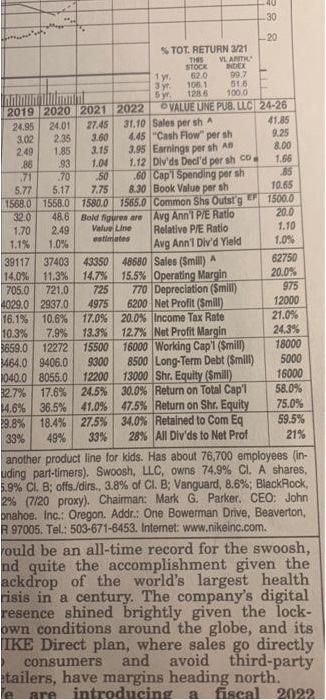
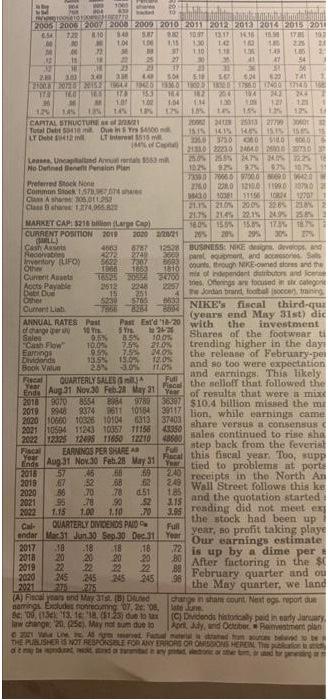
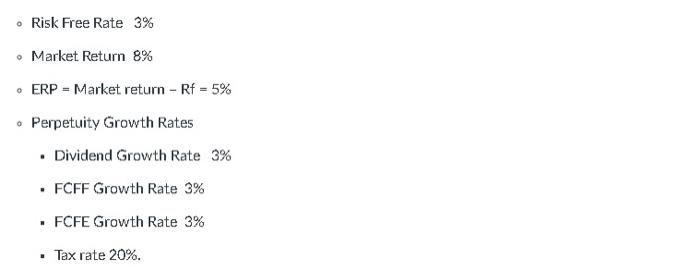
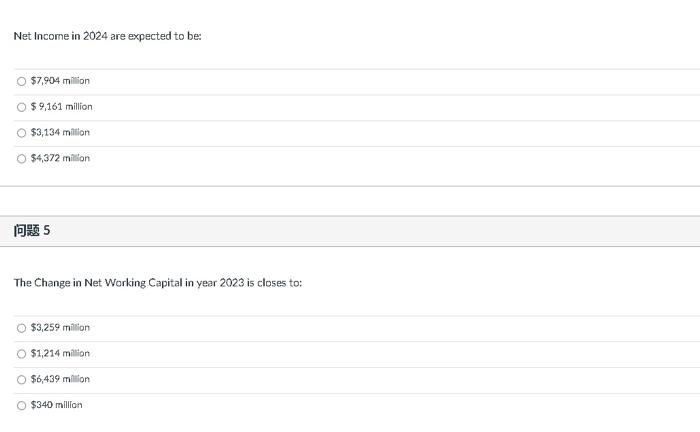
Risk Free Rate 3% Market Return 8% ERP = Market return - Rf = 5% Perpetuity Growth Rates Dividend Growth Rate 3% . FCFF Growth Rate 3% . FCFE Growth Rate 3% Tax rate 20%. Net Income in 2024 are expected to be: $7,904 million O$9,161 million O $3,134 million O $4,372 million 5 The Change in Net Working Capital in year 2023 is closes to: O $3,259 million O $1,214 million O $6,439 million O $340 million PIE NT 136.64 NIKE, INC. 'B' NYSENKE RELATIVE PE RATIO 40.8 ( 1.84 DVD YLD PRICE Media 240 TIMELINESS 3 High 23.1 24.6 40.1 400 66.2 65.4 65.2 06.0 1018 148.0 147.1 16.2 174 21.3 25.7 349 45.3 40.0 50.3 62.1 712 60.0 125.4 SAFETY TON LOW LEGENDS 10X Cash Flo TECHNICAL ngh BETA 1.10 (100-Ma - (212 1215 Dylan You 18-Month Target Price Range hatte das PORADY 2001 Low-High Midpoint to $91-4212 8152 (15) 2024-26 PROJECTIONS Price 178 (+30%) Low (+5% with Institutional Decisione STOT RETURN 3/21 """ 200 A INDEK 90.7 to thay 904 1065 shares STOCK Ty 42.0 3y 100.1 sj 1286 Ne To 700 21.6 Hrval/100101000031323772 100.0 VALUE LINE PUB. LLC 24-26 6.54 2005 2006 2007 2008 2009 2010 2011 2012 2013 2014 2015 2016 2017 2018 2019 2020 2021 2022 7:22 8.10 9.45 5.87 1.82 10.07 13:17 14.16 15.98 17.85 10.25 20.01 22.73 24.95 24.01 27.45 30 36 1.04 1.06 1.15 1.30 1.42 1.02 367 1.10 1.18 1.36 31.10 Sales per sh 41.05 66 1.25 46 72 M 88 2.40 12 15 18 21 25 1.45 2.25 2.02 301 2.95 1.49 1.85 2.16 2.51 AT 54 82 17 23 31 56 68 5.04 5.36 5.67 624 6.22 741 27 30 35 41 70 3.02 2.35 3.00 2.49 1.85 3.15 16 93 1.00 70 6.13 5.77 5.17 78 445 "Cash Flow sh 3.95 Eam persh A 1.12 Divids Dec'd per sh coa 50 Cap Spanding per sh 8.30 Book Valus per sh 12 16 23 33 36 67 64 71 50 2.69 3.03 340 440 7.29 7.55 7.75 She Outst'g 2100.8 2072.0 20152 19544 1943 1936.0 1902.0 1832.0 1788.0 1740.0 1714.0 1682.0 1643.0 16010 1568.0 1568.0 1580.0 1565.0 Com 17.9 16.0 16.5 176 15.3 16.4 16.2 20.4 194 242 244 275 21.6 25.3 32.0 456 Bold fires are 95 86 88 1.07 1.02 1.04 1.14 1.30 1.09 1.27 123 1.44 1.09 1.37 1.70 249 Value Line 1.2% 1.4% 1,5% 145 18% 1.7% alates 1.5% 1.4% 1.5% 1.3% 12% 1.0% 1.3% 1.3% 1.1% 1.0% CAPITAL STRUCTURE as of 2/28/21 Avg Anni P/E Ratio Relative P/E Ratio Avg Ann1 Div'd Yield 20852 24126 25313 27799 30601 32376 34350 38397 39117 37403 43350 48680 Sales (Smill) Total Debit 50416 mill. Dum in 5 You sem mill AC AME 56 16 An' Total Gam Returs Partit 289 CHERERA 0.8% VALUE LINE Target Price Range 2024 2025 2026 200 is is BBB Bg 88 110 -100 8.00 1.66 85 10.65 1500.0 20.0 1.10 1.0% 62750 30 -20 % TOT. RETURN 3/21 THIS VLANITH STOCK INDEX 1.y. 62.0 99,7 3yt. 100.1 51.6 Syr. 128.6 100.0 2019 2020 2021 2022 VALUE LINE PUB. LLC 24-26 24.95 24.01 27.45 31.10 Sales per sh A 41.85 9.25 3.02 2.35 3.60 4.45 "Cash Flow" per sh 2.49 1.85 3.15 3.95 Earnings per sh An 8.00 86 93 1.04 1.12 Div'ds Decl'd per sh coa 1.66 171 .70 50 85 60 Cap'l Spending per sh 8.30 Book Value per sh 5.77 5.17 7.75 10.65 1568.0 1558.0 1580.0 1565.0 1500.0 32.0 48.6 Bold figures are Common Shs Outst'g Avg Ann'l P/E Ratio Relative P/E Ratio 20.0 1.70 2.49 Value Line 1.10 estimates 1.1% 1.0% Avg Ann'l Div'd Yield 1.0% 62750 39117 37403 43350 48680 Sales (Smill) A 14.0% 11.3% 14.7% 15.5% Operating Margin 705.0 20.0% 721.0 725 770 Depreciation (Smill) 975 4029.0 2937.0 4975 6200 Net Profit (Smill) 12000 16.1% 10.6 % 21.0% 17.0% 20.0% Income Tax Rate 12.7% Net Profit Margin 10.3% 7.9 % 13.3% 24.3% 3659.0 12272 15500 18000 16000 Working Cap'l (Smill) 8500 Long-Term Debt ($mill) 464.0 9406.0 9300 5000 1040.0 8055.0 12200 16000 13000 Shr. Equity (Smill) 30.0% Return on Total Cap'l 32.7% 17.6% 24.5% 58.0% $4.6% 36.5% 41.0% 47.5% Return on Shr. Equity 75.0% 29.8% 18.4% 27.5% 34.0% Retained to Com Eq 59.5% 33% 49% 33% 28% All Div'ds to Net Prof 21% another product line for kids. Has about 76,700 employees (in- uding part-timers). Swoosh, LLC, owns 74.9% Cl. A shares, 5.9% CI. B; offs./dirs., 3.8% of Cl. B; Vanguard, 8.6%; BlackRock, 2% (7/20 proxy). Chairman: Mark G. Parker. CEO: John onahoe. Inc.: Oregon. Addr.: One Bowerman Drive, Beaverton, R 97005. Tel.: 503-671-6453. Internet: www.nikeinc.com. rould be an all-time record for the swoosh, nd quite the accomplishment given the ackdrop of the world's largest health risis in a century. The company's digital resence shined brightly given the lock- own conditions around the globe, and its IKE Direct plan, where sales go directly and avoid third-party consumers tailers, have margins heading north. are introducing a fiscal 2022 1005 shele 439 www. backed 101010 Tinna Amaline spr 2005 2006 2007 2008 2009 2010 2011 2012 2013 2014 2015 2011 4.54 722 10 102 $40 1.00 1.00 10 M 5.87 8.30 10.97 13.37 1436 15.50 17.8 1.15 130 1.0 140 140 28 1.10 1.18 28 * 22 38 M 37 L 148 1.80 2 NE 11 AM 22 21 30 35 41 AT 54 HE TEK 25 29 337 33 31 364 30 50 2.30 30 338 LO 604 6.22 741 21008 303 5.01 510 10 507282152 1647 1942550017960 160 FROS 175 155 HA 182 200 CIVA M 1.01 1.00 1:04 434 100 37146 168 302 244 Y 36 M NON 1.21 1.00 LAS Les 1.27 15% 1.3 1.45 LIN 125 17% 14% 1.3% as of 22 Que in 5 Yrs $4500 LT Inter 515 m CAPITAL STRUCTURE Total Debt 50410 m LY Debt 12 mill 25313 27790 3000 2002 241 1515 1415 HPS 1515 1545 25.0 3750 0510 000 21310 22230 24040 200000 144% of Cp Leases, Uncapitalland Annual rentals $563 m No Defined Benet Pension Plan Preferred Stock None 25.0% 258% 26.7% 24.775 1225 102% 92% 97% 97% 0.7% 733979665 97000 90 420 276.0 228.0 3210.0 11990 070 430 1008111156 1082 12207 21.1% 21.0% 20.0% 2285 28% Common Stock 578.74 es Class A shares 106,011252 Class 9 shares 1,274,955822 MARKET CAP: $216 billion (Larpe Cap) 21.7% 21.4% 22.1% 2495 2585 18.0% 15.5% 15.0% 17.3% 187 20% 29% 30% 17% CURRENT POSITION 2019 2020 2/20/21 (ALL) 4663 6787 12528 4000 2749 Cash Assets Recorvaties Inventory (LIFO) Other 5622 7307 1966 1663 1810 16525 20 34700 2612 2248 2257 Current Assets Aucts Payable Debt Due Other Current Liab 2015 251 5765 8833 5230 7958 8284 800 Past 10 9 9.5% ANNUAL RATES of change per Sales Cash Flow Earrings Dividends Book Valu Past Est'd 18-20 SYI (4) 85% 100% 10,0% 7.5% 21.0% 9.5% 35% 24.0% 13.5% 15.0% 12.0% 30% 11.0% 23% Fut Recal QUARTERLY SALES Year Ends Aug 21 Nov 30 Feb 21 May 21 is Year 36397 10164 2018 9070 8554 884 9789 2019 9948 9374 511 2020 10600 10326 10104 6313 37403 2021 10594 11243 10357 11156 43350 2022 12325 12495 11650 12210 BUSINESS: NIKE designs, develops, and 3 part equpment, and accessories Sel B003 counts, through NIKE-owned stores and the m of independent distributors and Scene es Ofenings are focused in stx categone The Jordan brand foobial (soccer training NIKE's fiscal third-qua (years end May 31st) dic with the investment Shares of the footwear ti trending higher in the day the release of February-pei and so too were expectation and earnings. This likely the selloff that followed the of results that were a mixe $10.4 billion missed the ma 39117 lion, while earnings came share versus a consensus ( sales continued to rise sha step back from the feverish tied to problems at porta this fiscal year. Too, supp receipts in the North An 2.49 Wall Street follows this ke and the quotation started reading did not meet exp the stock had been up year, so profit taking playe Our earnings estimate is up by a dime per 80 After factoring in the st February quarter and ou the May quarter, we land 48680 Fiscal Year EARNINGS PER SHARE AR Full Ends Aug 31 Nov 30 Feb.28 May 31 Focal 2016 57 45 66 2019 67 52 68 2020 56 70 78 1.85 2021 95 78 90 $2 3.15 2022 1.15 1.00 1.10 70 3.95 Cal- QUARTERLY DIVIDENDS PAID Full ender Mac 31 Jun 30 Sep.30 Dec.31 Year 2017 18 18 18 18 72 20 20 20 2018 20 2019 22 2020 245 22 22 22 88 245 245 96 2021 change in sham count Next ogs report du late June 245 375 275 (A) Fiscal years and May 31st (8) Duned gamings Excludes nonrecuming 07, 208, Ac 09 (13) 13. 16: 18, ($1.23) due to tax law change: 211, (25) May not sum due to 221 VAN LIMA net Fatal meter THE PUBLISHER IS NOT RESPONSIBLE FOR A of my te dra donta (C) Dividends historically paid in early January April, July, and October Painvestment plan dated sources belved to be TONISSIONS HEREN The publication ay pad on or ster bm, or und hir pan ERRORS | 69 240 62 d51 Risk Free Rate 3% Market Return 8% ERP = Market return - Rf = 5% Perpetuity Growth Rates Dividend Growth Rate 3% . FCFF Growth Rate 3% . FCFE Growth Rate 3% Tax rate 20%. Net Income in 2024 are expected to be: $7,904 million O$9,161 million O $3,134 million O $4,372 million 5 The Change in Net Working Capital in year 2023 is closes to: O $3,259 million O $1,214 million O $6,439 million O $340 million Risk Free Rate 3% Market Return 8% ERP = Market return - Rf = 5% Perpetuity Growth Rates Dividend Growth Rate 3% . FCFF Growth Rate 3% . FCFE Growth Rate 3% Tax rate 20%. Net Income in 2024 are expected to be: $7,904 million O$9,161 million O $3,134 million O $4,372 million 5 The Change in Net Working Capital in year 2023 is closes to: O $3,259 million O $1,214 million O $6,439 million O $340 million PIE NT 136.64 NIKE, INC. 'B' NYSENKE RELATIVE PE RATIO 40.8 ( 1.84 DVD YLD PRICE Media 240 TIMELINESS 3 High 23.1 24.6 40.1 400 66.2 65.4 65.2 06.0 1018 148.0 147.1 16.2 174 21.3 25.7 349 45.3 40.0 50.3 62.1 712 60.0 125.4 SAFETY TON LOW LEGENDS 10X Cash Flo TECHNICAL ngh BETA 1.10 (100-Ma - (212 1215 Dylan You 18-Month Target Price Range hatte das PORADY 2001 Low-High Midpoint to $91-4212 8152 (15) 2024-26 PROJECTIONS Price 178 (+30%) Low (+5% with Institutional Decisione STOT RETURN 3/21 """ 200 A INDEK 90.7 to thay 904 1065 shares STOCK Ty 42.0 3y 100.1 sj 1286 Ne To 700 21.6 Hrval/100101000031323772 100.0 VALUE LINE PUB. LLC 24-26 6.54 2005 2006 2007 2008 2009 2010 2011 2012 2013 2014 2015 2016 2017 2018 2019 2020 2021 2022 7:22 8.10 9.45 5.87 1.82 10.07 13:17 14.16 15.98 17.85 10.25 20.01 22.73 24.95 24.01 27.45 30 36 1.04 1.06 1.15 1.30 1.42 1.02 367 1.10 1.18 1.36 31.10 Sales per sh 41.05 66 1.25 46 72 M 88 2.40 12 15 18 21 25 1.45 2.25 2.02 301 2.95 1.49 1.85 2.16 2.51 AT 54 82 17 23 31 56 68 5.04 5.36 5.67 624 6.22 741 27 30 35 41 70 3.02 2.35 3.00 2.49 1.85 3.15 16 93 1.00 70 6.13 5.77 5.17 78 445 "Cash Flow sh 3.95 Eam persh A 1.12 Divids Dec'd per sh coa 50 Cap Spanding per sh 8.30 Book Valus per sh 12 16 23 33 36 67 64 71 50 2.69 3.03 340 440 7.29 7.55 7.75 She Outst'g 2100.8 2072.0 20152 19544 1943 1936.0 1902.0 1832.0 1788.0 1740.0 1714.0 1682.0 1643.0 16010 1568.0 1568.0 1580.0 1565.0 Com 17.9 16.0 16.5 176 15.3 16.4 16.2 20.4 194 242 244 275 21.6 25.3 32.0 456 Bold fires are 95 86 88 1.07 1.02 1.04 1.14 1.30 1.09 1.27 123 1.44 1.09 1.37 1.70 249 Value Line 1.2% 1.4% 1,5% 145 18% 1.7% alates 1.5% 1.4% 1.5% 1.3% 12% 1.0% 1.3% 1.3% 1.1% 1.0% CAPITAL STRUCTURE as of 2/28/21 Avg Anni P/E Ratio Relative P/E Ratio Avg Ann1 Div'd Yield 20852 24126 25313 27799 30601 32376 34350 38397 39117 37403 43350 48680 Sales (Smill) Total Debit 50416 mill. Dum in 5 You sem mill AC AME 56 16 An' Total Gam Returs Partit 289 CHERERA 0.8% VALUE LINE Target Price Range 2024 2025 2026 200 is is BBB Bg 88 110 -100 8.00 1.66 85 10.65 1500.0 20.0 1.10 1.0% 62750 30 -20 % TOT. RETURN 3/21 THIS VLANITH STOCK INDEX 1.y. 62.0 99,7 3yt. 100.1 51.6 Syr. 128.6 100.0 2019 2020 2021 2022 VALUE LINE PUB. LLC 24-26 24.95 24.01 27.45 31.10 Sales per sh A 41.85 9.25 3.02 2.35 3.60 4.45 "Cash Flow" per sh 2.49 1.85 3.15 3.95 Earnings per sh An 8.00 86 93 1.04 1.12 Div'ds Decl'd per sh coa 1.66 171 .70 50 85 60 Cap'l Spending per sh 8.30 Book Value per sh 5.77 5.17 7.75 10.65 1568.0 1558.0 1580.0 1565.0 1500.0 32.0 48.6 Bold figures are Common Shs Outst'g Avg Ann'l P/E Ratio Relative P/E Ratio 20.0 1.70 2.49 Value Line 1.10 estimates 1.1% 1.0% Avg Ann'l Div'd Yield 1.0% 62750 39117 37403 43350 48680 Sales (Smill) A 14.0% 11.3% 14.7% 15.5% Operating Margin 705.0 20.0% 721.0 725 770 Depreciation (Smill) 975 4029.0 2937.0 4975 6200 Net Profit (Smill) 12000 16.1% 10.6 % 21.0% 17.0% 20.0% Income Tax Rate 12.7% Net Profit Margin 10.3% 7.9 % 13.3% 24.3% 3659.0 12272 15500 18000 16000 Working Cap'l (Smill) 8500 Long-Term Debt ($mill) 464.0 9406.0 9300 5000 1040.0 8055.0 12200 16000 13000 Shr. Equity (Smill) 30.0% Return on Total Cap'l 32.7% 17.6% 24.5% 58.0% $4.6% 36.5% 41.0% 47.5% Return on Shr. Equity 75.0% 29.8% 18.4% 27.5% 34.0% Retained to Com Eq 59.5% 33% 49% 33% 28% All Div'ds to Net Prof 21% another product line for kids. Has about 76,700 employees (in- uding part-timers). Swoosh, LLC, owns 74.9% Cl. A shares, 5.9% CI. B; offs./dirs., 3.8% of Cl. B; Vanguard, 8.6%; BlackRock, 2% (7/20 proxy). Chairman: Mark G. Parker. CEO: John onahoe. Inc.: Oregon. Addr.: One Bowerman Drive, Beaverton, R 97005. Tel.: 503-671-6453. Internet: www.nikeinc.com. rould be an all-time record for the swoosh, nd quite the accomplishment given the ackdrop of the world's largest health risis in a century. The company's digital resence shined brightly given the lock- own conditions around the globe, and its IKE Direct plan, where sales go directly and avoid third-party consumers tailers, have margins heading north. are introducing a fiscal 2022 1005 shele 439 www. backed 101010 Tinna Amaline spr 2005 2006 2007 2008 2009 2010 2011 2012 2013 2014 2015 2011 4.54 722 10 102 $40 1.00 1.00 10 M 5.87 8.30 10.97 13.37 1436 15.50 17.8 1.15 130 1.0 140 140 28 1.10 1.18 28 * 22 38 M 37 L 148 1.80 2 NE 11 AM 22 21 30 35 41 AT 54 HE TEK 25 29 337 33 31 364 30 50 2.30 30 338 LO 604 6.22 741 21008 303 5.01 510 10 507282152 1647 1942550017960 160 FROS 175 155 HA 182 200 CIVA M 1.01 1.00 1:04 434 100 37146 168 302 244 Y 36 M NON 1.21 1.00 LAS Les 1.27 15% 1.3 1.45 LIN 125 17% 14% 1.3% as of 22 Que in 5 Yrs $4500 LT Inter 515 m CAPITAL STRUCTURE Total Debt 50410 m LY Debt 12 mill 25313 27790 3000 2002 241 1515 1415 HPS 1515 1545 25.0 3750 0510 000 21310 22230 24040 200000 144% of Cp Leases, Uncapitalland Annual rentals $563 m No Defined Benet Pension Plan Preferred Stock None 25.0% 258% 26.7% 24.775 1225 102% 92% 97% 97% 0.7% 733979665 97000 90 420 276.0 228.0 3210.0 11990 070 430 1008111156 1082 12207 21.1% 21.0% 20.0% 2285 28% Common Stock 578.74 es Class A shares 106,011252 Class 9 shares 1,274,955822 MARKET CAP: $216 billion (Larpe Cap) 21.7% 21.4% 22.1% 2495 2585 18.0% 15.5% 15.0% 17.3% 187 20% 29% 30% 17% CURRENT POSITION 2019 2020 2/20/21 (ALL) 4663 6787 12528 4000 2749 Cash Assets Recorvaties Inventory (LIFO) Other 5622 7307 1966 1663 1810 16525 20 34700 2612 2248 2257 Current Assets Aucts Payable Debt Due Other Current Liab 2015 251 5765 8833 5230 7958 8284 800 Past 10 9 9.5% ANNUAL RATES of change per Sales Cash Flow Earrings Dividends Book Valu Past Est'd 18-20 SYI (4) 85% 100% 10,0% 7.5% 21.0% 9.5% 35% 24.0% 13.5% 15.0% 12.0% 30% 11.0% 23% Fut Recal QUARTERLY SALES Year Ends Aug 21 Nov 30 Feb 21 May 21 is Year 36397 10164 2018 9070 8554 884 9789 2019 9948 9374 511 2020 10600 10326 10104 6313 37403 2021 10594 11243 10357 11156 43350 2022 12325 12495 11650 12210 BUSINESS: NIKE designs, develops, and 3 part equpment, and accessories Sel B003 counts, through NIKE-owned stores and the m of independent distributors and Scene es Ofenings are focused in stx categone The Jordan brand foobial (soccer training NIKE's fiscal third-qua (years end May 31st) dic with the investment Shares of the footwear ti trending higher in the day the release of February-pei and so too were expectation and earnings. This likely the selloff that followed the of results that were a mixe $10.4 billion missed the ma 39117 lion, while earnings came share versus a consensus ( sales continued to rise sha step back from the feverish tied to problems at porta this fiscal year. Too, supp receipts in the North An 2.49 Wall Street follows this ke and the quotation started reading did not meet exp the stock had been up year, so profit taking playe Our earnings estimate is up by a dime per 80 After factoring in the st February quarter and ou the May quarter, we land 48680 Fiscal Year EARNINGS PER SHARE AR Full Ends Aug 31 Nov 30 Feb.28 May 31 Focal 2016 57 45 66 2019 67 52 68 2020 56 70 78 1.85 2021 95 78 90 $2 3.15 2022 1.15 1.00 1.10 70 3.95 Cal- QUARTERLY DIVIDENDS PAID Full ender Mac 31 Jun 30 Sep.30 Dec.31 Year 2017 18 18 18 18 72 20 20 20 2018 20 2019 22 2020 245 22 22 22 88 245 245 96 2021 change in sham count Next ogs report du late June 245 375 275 (A) Fiscal years and May 31st (8) Duned gamings Excludes nonrecuming 07, 208, Ac 09 (13) 13. 16: 18, ($1.23) due to tax law change: 211, (25) May not sum due to 221 VAN LIMA net Fatal meter THE PUBLISHER IS NOT RESPONSIBLE FOR A of my te dra donta (C) Dividends historically paid in early January April, July, and October Painvestment plan dated sources belved to be TONISSIONS HEREN The publication ay pad on or ster bm, or und hir pan ERRORS | 69 240 62 d51 Risk Free Rate 3% Market Return 8% ERP = Market return - Rf = 5% Perpetuity Growth Rates Dividend Growth Rate 3% . FCFF Growth Rate 3% . FCFE Growth Rate 3% Tax rate 20%. Net Income in 2024 are expected to be: $7,904 million O$9,161 million O $3,134 million O $4,372 million 5 The Change in Net Working Capital in year 2023 is closes to: O $3,259 million O $1,214 million O $6,439 million O $340 million