Answered step by step
Verified Expert Solution
Question
1 Approved Answer
Risk (Individual Securities) In this mini-project you will select 3 stocks with varied volatility, calculate the basic measures of risk and produce a histogram

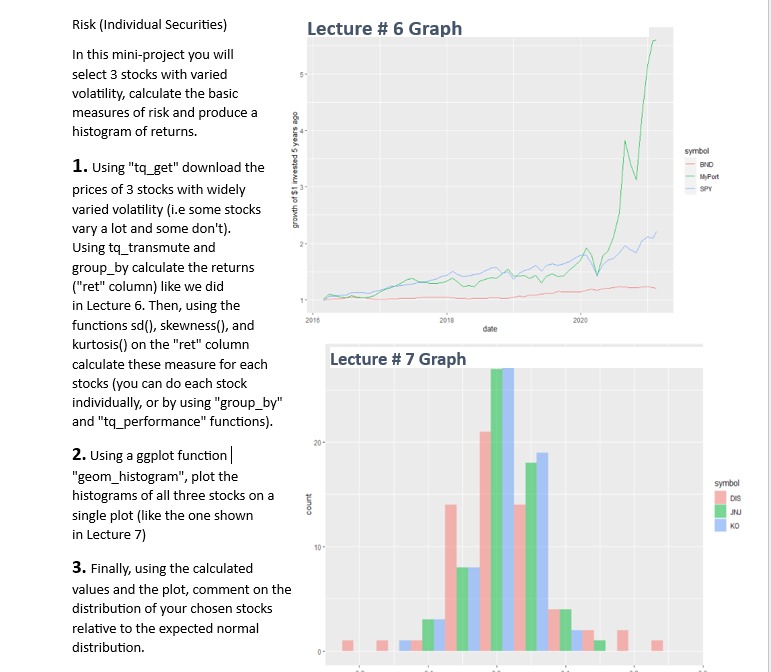
Risk (Individual Securities) In this mini-project you will select 3 stocks with varied volatility, calculate the basic measures of risk and produce a histogram of returns. 1. Using "tq_get" download the prices of 3 stocks with widely varied volatility (i.e some stocks vary a lot and some don't). Using tq_transmute and group_by calculate the returns ("ret" column) like we did in Lecture 6. Then, using the functions sd(), skewness(), and kurtosis() on the "ret" column calculate these measure for each stocks (you can do each stock individually, or by using "group_by" and "tq_performance" functions). 2. Using a ggplot function "geom_histogram", plot the histograms of all three stocks on a single plot (like the one shown in Lecture 7) growth of $1 invested 5 years ago 3. Finally, using the calculated values and the plot, comment on the distribution of your chosen stocks relative to the expected normal distribution. Lecture # 6 Graph 1- 2016 20- 10- 2018 Lecture # 7 Graph date 2020 symbol BND MyPort SPY symbol DIS JNJ KO
Step by Step Solution
★★★★★
3.36 Rating (152 Votes )
There are 3 Steps involved in it
Step: 1
To complete this miniproject we need to select three stocks with varied volatility and calculate the basic measures of risk We will use the tidyquant ...
Get Instant Access to Expert-Tailored Solutions
See step-by-step solutions with expert insights and AI powered tools for academic success
Step: 2

Step: 3

Ace Your Homework with AI
Get the answers you need in no time with our AI-driven, step-by-step assistance
Get Started


